And Albuquerque Is Where? The Effect Of Travel Distance On NCAA Tournament Play | Stat Geek Idol
March 17, 2012 - by Michael Lopez
***NOTE*** This is a Round of 64 entry in our inaugural Stat Geek Idol contest. The opinions or predictions expressed below do not represent the views of TeamRankings.com, and are solely those of the author. This article was conceived of and written by Michael Lopez.
Teams selected for March Madness can control the level of opponent they’ll face, but where the game is played depends mostly on the selection committee and which sites happen to be hosting.
Previous analysis of the effect of distance traveled on performance is limited, although Ward and Davenhall suggest that, after accounting for team seeding, distance may be a determining factor in the probability of a team winning each game.
The goal of this analysis will be to consider the impact of distance on tournament performance.
Over 25% Of NCAA Tournament Teams Travel 1,000+ Miles
The 323 tournament contests (including play-in games) from 2007-2011 comprise our sample. For our purposes, play-in games are mixed with first-round ones. The shortest distance traveled was Butler (0 miles, 2011 championship weekend), with St. Mary’s traveling the longest (2,666 miles to Providence, 2010 rounds 1 and 2).
Seeds 1, 2, and 3 tend to require a shorter travel distance to games, with median distances under 500 miles, compared with other teams. Two-seeds have the lowest median travel distance (321 miles), while seeds 4, 5, and 7, and 10-14 all have median travel distances of roughly 1,000 miles per round. Mysteriously, seeds 8 and 9 seem to travel a shorter distance than teams of a similar seed, with median distances of roughly 600 miles.
The 75th percentile for distance traveled is 1,165 miles, just above the 1,116 miles Vanderbilt is traveling to Albuquerque this spring. So, while roughly 25 percent of trips are in fact longer than what is demanded of the Commodores, the trek is extensive enough that their coach can now give an excuse for another round 1 fail before tip-off.
How Travel Might Affect Performance
One can imagine that distance traveled can have a wide range of effects on performance, as players may perform at an optimal level when they are in familiar surroundings. While playing near campus encourages a larger turnout among a team’s fans, that’s potentially more of a benefit for schools with larger followings. Fans at neutral sites, meanwhile, traditionally cheer for, or even chant for the underdog.
Of the 71 games held within 500 miles of both team campuses, favorites won 76% of the time, covering the spread at a 55% clip. Of the 39 contests in which both squads had to travel at least 1,000 miles, favorites won just 59% of the time, covering in 43% of these match-ups. These numbers suggest a mild association between game location and outcome, as the team expected to win does so more often nearby home.
Travel Seems To Affect Favorites And Underdogs Differently
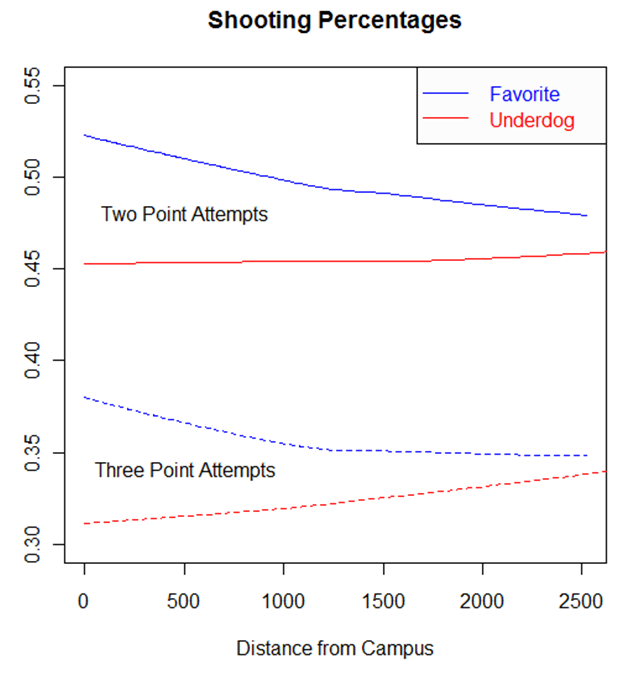
The figure below portrays a team’s shooting performance, distinct for favorites and underdogs, as judged by the Las Vegas point-spread. Both two and three-point FG percentages are smoothed using a Lowess smoother with smoothing parameter 1. This smoothing model attempts to approximate a fit between distance traveled and shooting percentage, when the true relationship (straight line, u-shaped, or something else) is unknown.
It is not surprising to see favorites shooting at higher percentages than their counterparts, as the blue smoothed lines lie above the red ones.
However, the trends over time suggest a different effect of distance traveled among team types. Underdogs tend to shoot three-pointers at a higher percentage in games further from campus. Favorites, meanwhile, see their three-point and two-point field goal percentages dropping as travel distance increases. These trends validate the previous suggestion that favorites reach an optimal performance when playing closer to home.
Offenses Improve In The Second Round
Of course, with the majority of travel for tournament play done early in the week, one might expect different results comparing games played on Tuesday, Thursday, and Friday versus those held on Saturday and Sunday, when teams have settled into their new surroundings.
In fact, games held on Tuesday, Thursday, and Friday averaged more than a turnover and a half more (24.5 per-game) compared with weekend or championship game contests (23 per-game). This difference was found statistically significant using a t-test for difference means, conducted at the 5% significance level.
There’s also a direct effect on the number of points scored in each contest, as shown by the frequency of times the “Over” and the “Under” hits, by round. Games hit the “Over” when the both team’s combine for more points than the number set by gambling experts. Looking at the first four rounds, Tuesday, Thursday and Friday games paid the “Under” more often than not (110 of 204, or 54%), while weekend games paid more on “Over” bets (59 of 98, or 60%). It certainly seems possible that extra practice in a new arena leads to increased offensive output, or that the effect of travel wears off once a team settles.
In all, distance traveled appears to play a role in March Madness, perhaps an explanation for these changes, as teams are now reportedly being assigned locally whenever possible. In practice, however, this goal was not met; the median distance traveled for 2012 first-round games is 606 miles, which is actually longer than the median distance of 588 miles from 2011 first-round contests.
Printed from TeamRankings.com - © 2005-2024 Team Rankings, LLC. All Rights Reserved.
