TeamRankings.com
Get Smart About Sports
March 15, 2020 - by David Hess
For descriptions of all the models we use to make game winner, spread, totals, and money line predictions, see our Models, Models, Everywhere blog post.
Betting - Survivor - Pick’em
These colors indicate whether the model’s prediction agrees with our Official TR pick. Predictions shown in green are in concordance with the Official TR pick, and those in red are in disagreement. We feel that color coding the outputs helps users see with a quick glance whether there is consensus among our models, or if there is a split decision.
For each sport and pick type, we use a technique called logistic regression to combine output of all our models. This technique determines how much weight each of our models should get, in order to maximize our prediction accuracy. In some cases, the Decision Tree rules all, but in other cases, giving partial weight to other models helps. For more information, see About Our Picks.
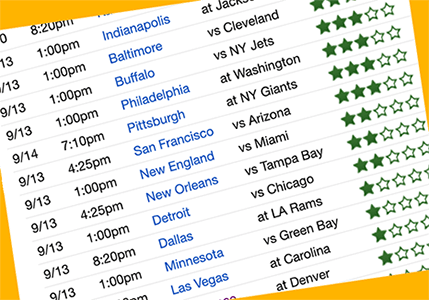
Our Confidence star ratings tell you how likely we think it is that our prediction will be correct. They are based on precise numerical values (see “What do the Odds column represent?” below), not some wishy-washy gut feelings, and they mean different things for Game Winner picks and for betting picks. For details, please see About Our Picks.
The Confidence star rating of an Official TR pick is determined by how accurate we’ve been in the past when predicting games similar to the one in question. We define games as similar based on our projections for them. Those similar games are some of the inputs to the regression model, meaning they will influence the model to make its future estimates closer to the actual success rate that we had on the old picks. For more details on our Official TR picks, see About Our Picks.
The Odds column is the numerical value upon which the Confidence stars are based. This is the output of the logistic regression that combines info from all our models. It’s our best guess for a team’s win odds or chance of covering, an over/under’s likelihood, or how far above the money line break even point a team’s estimated chance of winning is.
That’s actually kind of a complicated question. We stop making new predictions 2 hours before a game starts. However, those predictions are initially only in our database. Because our site update scripts (which make sure the new predictions are displayed on the site) run in cycles, it could be anywhere from 5 minutes to nearly two hours before a new prediction is displayed. This means that there is no set lock time for the predictions you see, other than “before the game starts.” Actually, in our ideal world, our models would continue to update right up until tipoff or kickoff, so they could react to last minute line changes, but that’s not technically feasible at this time. Finally, please note that each game locks on an individual basis, according to its own start time — not en masse prior to the start of the day’s first game.
A Game Winner pick is simply the team we think has a greater than 50% chance to win the game.
A Money Line pick tells you which team we project to be a better value bet, using the money line odds.
For example, if you bet $200 on the Yankees as -200 money line favorites over the Royals, you would win $100 if the Yankees win, and lose $200 if the Yankees lose. That means you would need the Yankees to win 2 out of every 3 times in order to break even on your bet over the long run. So, if we project the win odds for the Yankees to be greater than 67%, they would be our money line pick. On the other hand, if we project the Yankees’ win odds to be less that 67%, our money line pick would either be the Royals or LAY OFF (depending on what the Royals’ odds are). Let’s say we project the Yankees to have a 60% chance to win the game. The Yankees would be our Game Winner pick, but the Royals would likely be our Money Line pick.
Basically, because they are the outputs of two different models. We have two separate versions of each of our models, one optimized for picking winners, and one optimized for picking against the spread. Usually, they give the same results, but on occasion, they disagree, just as our Decision Tree and Power ratings models sometimes disagree about which team will win a game.
In situations where picks conflict, one thing you might want to take into account is how confident each pick is. Picks with a confidence rating of only a single star are close to toss-ups in the eyes of the model. Also, looking at our season results page can give you an idea of how often each model is right in a given situation. For example, our Decision Tree ATS model has been correct on 51.1% of games this year, while our Decision Tree Game Winner model has chosen the correct team 60.0% percent of the time when the published confidence is between 50% and 64%.
In the end, which model should take priority is a judgment call. We always advise you take context into consideration when interpreting our model outputs. In this case, that context is that there is another model in disagreement, so you may want to temper your confidence in the pick.
We keep detailed prediction accuracy records for the past 14 NCAA tournaments, broken down by confidence rating. If you want one number, we’ve predicted 71.3% of games correctly over the past 13 years, though our performance has been slightly better in recent years: we’ve gotten 73.1% correct over the past four years.
As with the tournament game winner accuracy, we keep detailed records of our regular season accuracy. As I write this on February 9th, 2012, we’ve predicted 5,159 games, and gotten 75.1% correct. For a complete breakdown by month and confidence rating, see College Basketball Picks Season Results.
We keep detailed records of the accuracy of our past betting predictions since the 2007-08 season, which can be found at our College Basketball Picks Yearly Results page. Over that time, our Official TR picks have compiled a 52.1% record against the spread over all games, and we have a 53.3% record on our three-star confidence Official TR picks.
Our Decision Tree model, which is the primary model used to make ATS picks, only started generating predictions in 2008, so our data doesn’t go back very far. We’ve gotten a lot of requests for our NCAA tournament betting picks record, so we’ll post it here, but please keep in mind that a sample size of ~200 games is quite small, and pales in comparison to the amount of data we have on our accuracy during the regular season, which can be found at College Basketball Picks Yearly Results.
During the 2011-12 regular season, through February 9th our 2 star or better totals picks were 771-608-22 (56.1%, +102.2 units at -110 vig). 2-star or better ATS picks were 681-625-23 (52.6%, +6.5 units at -110 vig).
Here is our yearly performance against the spread during the NCAA tournament:
| ATS by year | 3 Star | 2 Star | 1 Star | Total | ||||||||||||
|---|---|---|---|---|---|---|---|---|---|---|---|---|---|---|---|---|
| Year | W | L | P | Win% | W | L | P | Win% | W | L | P | Win% | W | L | P | Win% |
| 2011 | 0 | 0 | 0 | '-- | 7 | 8 | 0 | 46.7% | 21 | 30 | 1 | 41.2% | 28 | 38 | 1 | 42.4% |
| 2010 | 1 | 2 | 0 | 33.3% | 12 | 5 | 2 | 70.6% | 24 | 18 | 0 | 57.1% | 37 | 25 | 2 | 59.7% |
| 2009 | 0 | 1 | 0 | 0.0% | 7 | 10 | 0 | 41.2% | 23 | 23 | 0 | 50.0% | 30 | 34 | 0 | 46.9% |
| 2008 | 1 | 0 | 0 | 100.0% | 8 | 10 | 0 | 44.4% | 22 | 23 | 0 | 48.9% | 31 | 33 | 0 | 48.4% |
| Grand Total | 2 | 3 | 0 | 40.0% | 34 | 33 | 2 | 50.7% | 90 | 94 | 1 | 48.9% | 126 | 130 | 3 | 49.2% |
Our performance on totals picks during the NCAA tournament:
| OU by Year | 3 Star | 2 Star | 1 Star | Total | ||||||||||||
|---|---|---|---|---|---|---|---|---|---|---|---|---|---|---|---|---|
| Year | W | L | P | Win% | W | L | P | Win% | W | L | P | Win% | W | L | P | Win% |
| 2011 | 4 | 2 | 0 | 66.7% | 4 | 8 | 0 | 33.3% | 20 | 26 | 3 | 43.5% | 28 | 26 | 3 | 43.8% |
| 2010 | 1 | 1 | 0 | 50.0% | 13 | 10 | 0 | 56.5% | 28 | 11 | 0 | 71.8% | 42 | 22 | 0 | 65.6% |
| 2009 | 3 | 0 | 0 | 100.0% | 13 | 6 | 0 | 68.4% | 23 | 19 | 0 | 54.8% | 39 | 25 | 0 | 60.9% |
| 2008 | 2 | 2 | 0 | 50.0% | 7 | 6 | 1 | 53.8% | 18 | 26 | 2 | 40.9% | 27 | 34 | 3 | 44.3% |
| Grand Total | 10 | 5 | 0 | 66.7% | 37 | 30 | 1 | 55.2% | 89 | 82 | 5 | 52.0% | 136 | 117 | 6 | 53.8% |
And our money line results during the NCAA tournament:
| ML by year | 2 Star | 1 Star | Total | |||||||||
|---|---|---|---|---|---|---|---|---|---|---|---|---|
| Year | W | L | Win% | Units | W | L | Win% | Units | W | L | Win% | Units |
| 2011 | 10 | 7 | 58.8% | +1.5 | 20 | 22 | 47.6% | -1.2 | 30 | 29 | 50.8% | +0.4 |
| 2010 | 12 | 6 | 66.7% | +13.6 | 17 | 29 | 37.0% | -14.3 | 29 | 35 | 45.3% | -0.7 |
| 2009 | 4 | 9 | 30.8% | -5.6 | 13 | 32 | 28.9% | -18.7 | 17 | 41 | 29.3% | -24.3 |
| Grand Total | 26 | 22 | 54.2% | +9.6 | 50 | 83 | 37.6% | -34.2 | 76 | 105 | 42.0% | -24.6 |
For answer to any other questions you may have, please drop us a comment below, or email us via the contact link on the right.
Printed from TeamRankings.com - © 2005-2024 Team Rankings, LLC. All Rights Reserved.