Putting The ‘College’ Back In College Basketball: Can Academics Inform The Bracket? | Stat Geek Idol
March 23, 2012 - by Travis Gerke
This is a Sweet 16 submission in our inaugural Stat Geek Idol contest. It was conceived of and written by Travis Gerke.
When completing your bracket, what were the factors you considered?
Likely, you thought about things like seed, points per game, and strength of schedule, right? (Me too.)
These are, no doubt, important variables to weigh; however, might leaving the ‘college’ out of college basketball be detrimental? In the throes of March Madness, it is easy to forget that these teams represent institutions in which the primary goal is to educate, irrespective of the joys a trip to the Final Four may bring.
That said, might their success off the court help drive momentum on the court (and help us generate an improved bracket)?
Tournament Performance Vs. School Academic Performance
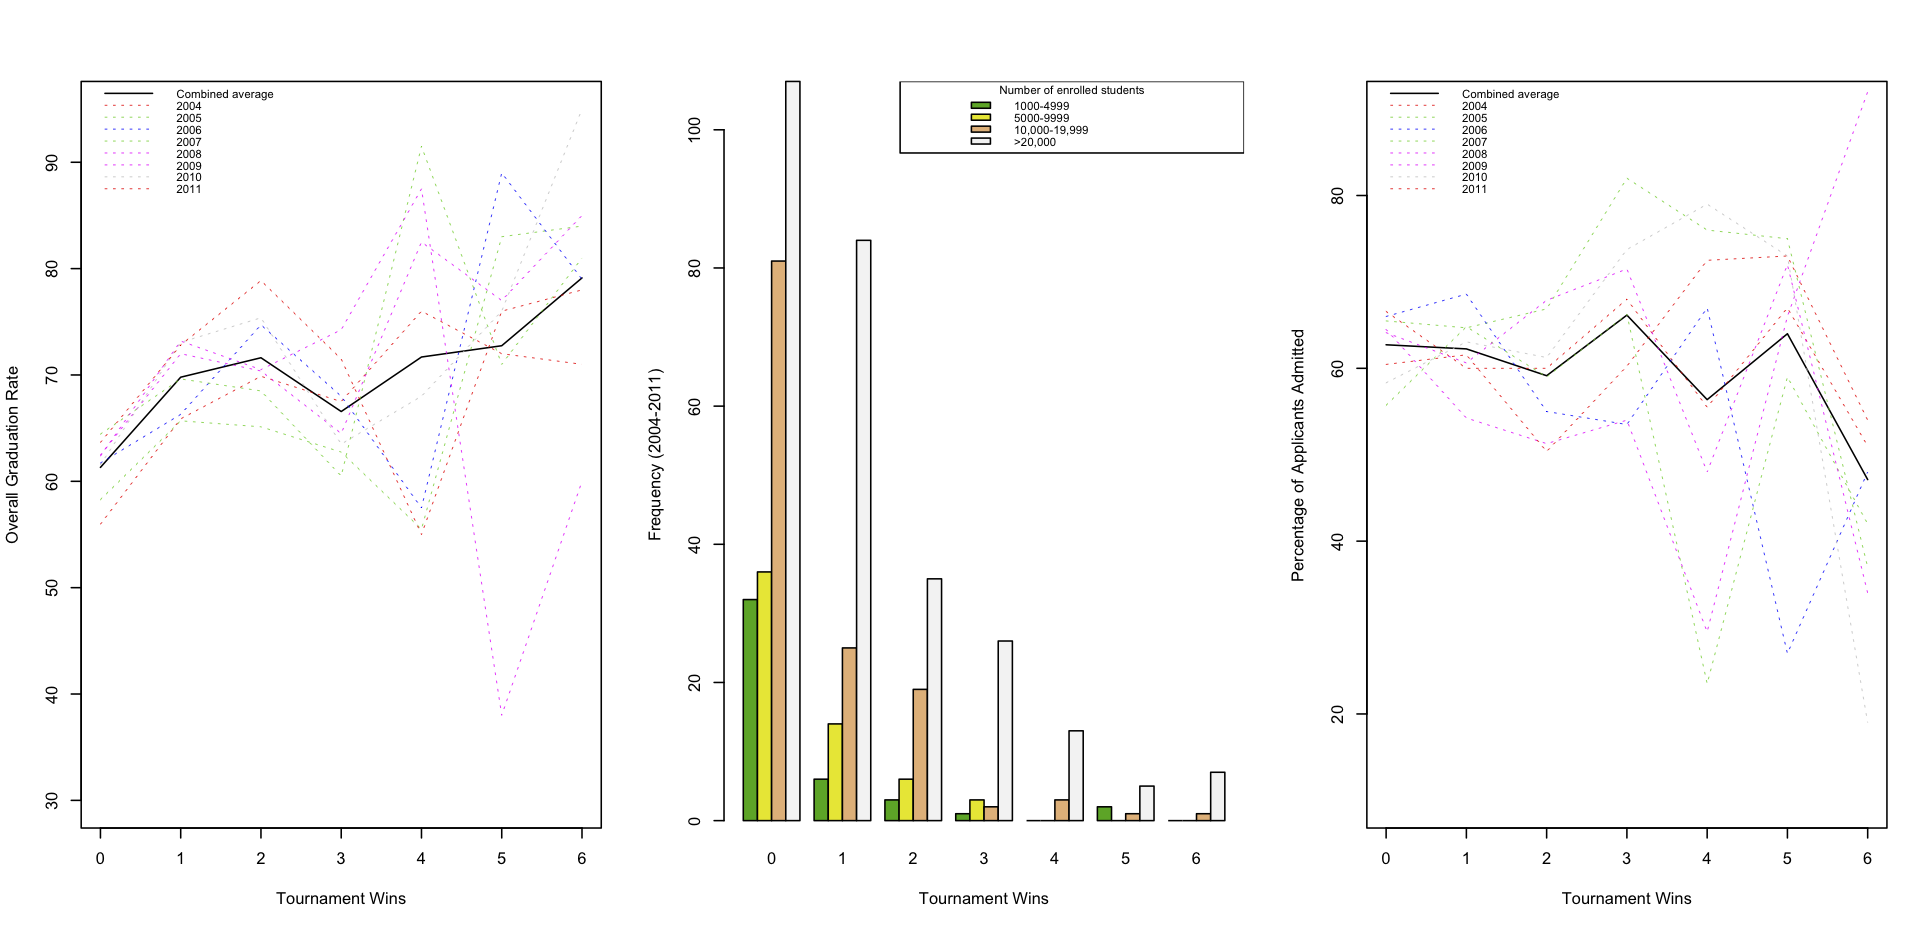
To place these teams in their institutional context, let’s take a look at data from the National Center for Education Statistics, pictured in Image 1.
(click to enlarge)
The graph on the far left plots team tournament wins (each win is, of course, indicative of advancement to a subsequent round) against overall graduation rate for the institution. Each of the colorful lines represents one season (2004-2011), with the solid black line giving the average trend over the 8 years. As you already know, for each year, there are 64 teams that enter the tournament; 32 of these win 0 games, 16 win 1 game, and so forth until we reach one champion that wins 6 games. This means that we have relatively few observations on the right-hand side of the graph, explaining the increasing variation among the colored lines as we move forward in the tournament.
Overall, the trend indicates that teams from schools with higher graduation rates tend to advance further. This pattern is particularly clear and consistent for winning any tournament games (when moving from the Round of 64 to the Round of 32).
The bar graph above illustrates the difficulty smaller schools (yellow and green – less than 10,000 students) face with respect to making long tournament runs. No teams from institutions with less than 10,000 students have won the tournament in the last 8 years. The unusual green spike at 5 wins, of course, corresponds to Butler’s success in 2010 and 2011.
The last plot in this image might hint that schools with more stringent admissions criteria may have more tournament wins. However, without more data to discern a clearer trend, this figure looks a lot like 99% of the plots statisticians generate (i.e. boring).
Tournament Performance Vs. Team Academic Performance
Now that we’ve had a bird’s-eye view of some institutional characteristics, we can zoom back in to the teams themselves by examining data from the NCAA.
(click to enlarge)
The figure on the far left 2 graphs academic progress rate (APR) against number of tournament wins. The APR is a summary measure that specifically tracks the academic achievement of teams in a given season. The graph on the far right plots tournament wins against team graduation rates. Like we saw with the institutional graduation rate, both of these measures of team academic success predict a strong tournament performance.
Since we’ve been examining benchmarks for success, we might also want to look at indicators of trouble. The bar graph above reveals that no team with at least one NCAA penalty has won more than two games in several years. These penalties are given when a team falls below a standard of academic progress. Overall, it appears that schools and teams with higher academic achievement perform better in the tournament.
Picking A Bracket That Makes The Grade
So what does all this mean for your bracket? While you probably don’t want to toss seed, points per game, and strength of schedule out the window, some of these other predictors may help guide your picks.
Are you still looking for a good reason that you should have chosen Lehigh over Duke? Consider this: Lehigh has the upper hand in academic progress rate, 994 to 990.
Printed from TeamRankings.com - © 2005-2024 Team Rankings, LLC. All Rights Reserved.

