Kansas City vs. Tampa Bay Super Bowl Matchup Stats: Who Has The Edge?
January 30, 2021 - by Jason Lisk

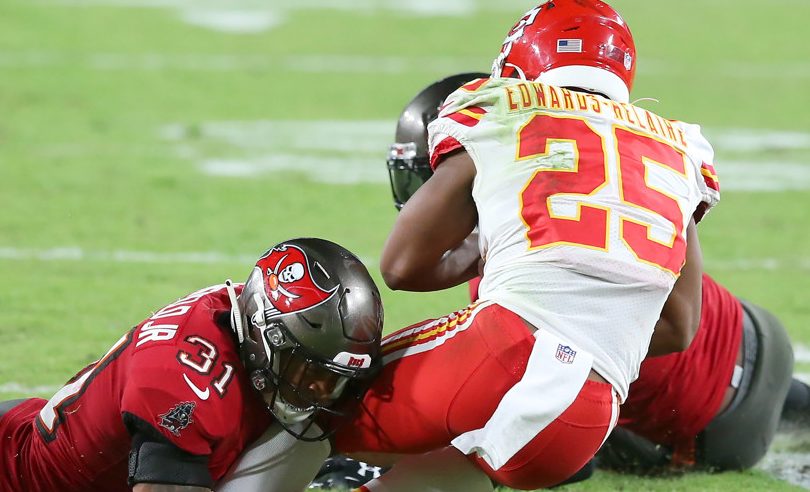
See where Kansas City and Tampa Bay have the advantage in the Super Bowl matchup (Photo by Cliff Welch/Icon Sportswire)
In this post, we provide a table summary of various team stats for the Kansas City Chiefs and Tampa Bay Buccaneers, and where they rank in the NFL (from 1st to 32nd). These stats include every regular season and playoff game result for the 2020 season.
You can find all of these same stats, and more, on our various NFL team stat pages, as well as the Super Bowl LV matchup stats and efficiency stats pages in our Super Bowl matchup section.
We have also written Super Bowl point spread trends and Super Bowl over/under trends analyses looking into how various past Super Bowl teams have performed situationally against those popular betting lines.
Overall Team Stats in Scoring and Yards
| CATEGORY | KC (Rank) | TB (Rank) |
|---|---|---|
| Points Scored per Game | 29.6 (5th) | 30.7 (2nd) |
| Points Allowed per Game | 22.4 (10th) | 22.3 (9th) |
| Point Differential per Game | 7.2 (5th) | 8.4 (2nd) |
| Red Zone TD Scoring % Offense | 61.4% (12th) | 64.9% (11th) |
| Offensive Yards per Game | 418.3 (1st) | 385.2 (6th) |
| Offensive First Downs per Game | 25 (1st) | 22.6 (12th) |
| Third Down Conversion % Offense | 49.5% (2nd) | 44.9% (8th) |
| Red Zone TD Allowed % Defense | 74.1% (32nd) | 62.3% (19th) |
| Defensive Yards per Game | 355.8 (15th) | 330.7 (8th) |
| Defensive 1st Downs Allowed/Game | 22.1 (18th) | 20.3 (7th) |
| Third Down Conversion % Defense | 40.9% (15th) | 42.2% (19th) |
Needless to say, both of these teams are good in a lot of the major NFL stat categories. Both rank in the top 5 in both scoring and scoring differential.
If anything, Kansas City’s scoring average understates how good they are on offense, as they rank 1st in both passing yards and first downs gained per game, while ranking only 5th in points.
Scoring Splits by Half
Get access to all betting content, picks and models
Free subscription offers now available!
Already a premium subscriber? Sign in for access
Printed from TeamRankings.com - © 2005-2024 Team Rankings, LLC. All Rights Reserved.