Measuring Offensive Balance In Basketball (Stat Geek Idol 2 Finalist)
April 8, 2013 - by Stephen Shea
This post is one of the five finalists in our second Stat Geek Idol contest. It was conceived of and written by Stephen Shea.
In 2006-07, the champion Florida Gators employed a balanced offensive attack, with five players averaging between 10.3 and 13.3 points per game. In contrast, the 2010-11 UConn Huskies relied heavily on the shots of Kemba Walker. The amount of balance in an offense can vary greatly between teams, and the game has seen champions at both ends of the spectrum. We quantify offensive balance (OB). We observe a surprisingly high correlation between OB and rank among the AP’s top 25 teams.
Higher OB corresponds to lower rank with one extreme outlier. In 2011, 11-seeded VCU made headlines with their run to the final four. VCU features an aggressive full court press, a system that requires a great deal of effort from its players on the defensive side of the ball. Perhaps reflecting Shaka Smart’s atypical system, the Rams are the one anomaly in our statistical analysis.
Defining Offensive Balance
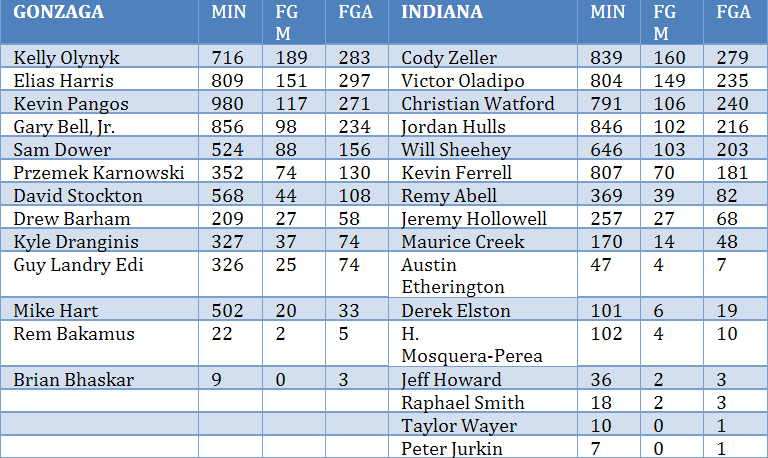
How does one quantify the degree of balance in an offense? Looking at the season statistics (as of March 4) for Gonzaga and Indiana in Table 1, it is not obvious which offense is more balanced.
Table 1: Gonzaga and Indiana Statistics through March 4, 2013
In Economics, one might be interested in the concentration in a particular market. How many companies are selling the same product, and what percentage of the market does each company have? Concentration affects competition and ultimately price and profits. Economists sometimes aggregate the concentration using information theoretic entropy formulas (from [4]). See [1] for more details. Motivated by the work of the economists, we will use entropy formulas in the calculation of OB. Instead of evaluating the concentrations of market shares, we will be aggregating the concentrations of minutes played and field goals made by players on a given team. Let our team T have players {1,2,…,N}. Let mi denote player i’s minutes played, and let

Let Mi=mi/mT, the percentage of minutes for player i among all minutes played. Similarly, define FGMi to be the percentage of field goals made by player i among all players on team T. Define the distribution of minutes (DM) and the distribution of field goals made (DFGM) for this team to be

Intuitively, the more players to play and the more balanced the minutes, the larger DM will be. Define OB=DFGM/DM. OB generally falls between .90 and 1, with higher numbers representing more balance. Kemba Walker’s UCONN Huskies of 2010-11 had an OB of .911. The idol of all gunners, Jimmer Fredette, ball-hogged BYU to a .890 that same year. The 2006-07 Florida Gators had an OB of .989.
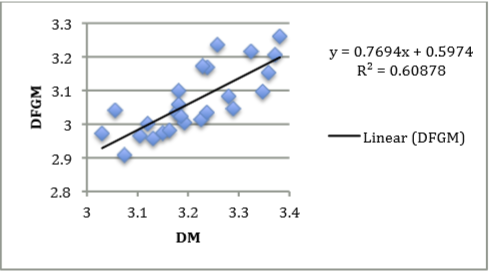
Over the course of a season, several factors can inflate DM, such as injuries and back-up players getting extra minutes in a blow out. DM drives DFGM, as demonstrated in Chart 1. Neither DFGM nor DM correlates highly with rank for the AP top 25. By considering the ratio of DFGM to DM we are asking the degree which all 5 players on the court share the offensive load, regardless of how many players have seen significant playing time. Surprisingly, Chart 2 shows a correlation between OB and rank for this year’s top teams.
Chart 1: DFGM to DM for AP Top 25 as of March 4, 2013
AP Top 25 as of March 4, 2013

We believe the high correlation demonstrated in Chart 2 is atypical. We do not mean to imply that college basketball teams should strive to have a low OB. Although, there have been some impressive basketball teams with unbalanced offenses. For example, the 1995-96 (72 win) Chicago Bulls had an OB of .919. We present the correlation in Chart 2 as a characterization of this year’s best teams. None of this year’s top 10 teams use a balanced offensive attack comparable to the 06-07 Florida Gators.
Chart 2: OB to Rank for AP Top 25 as of March 4, 2013
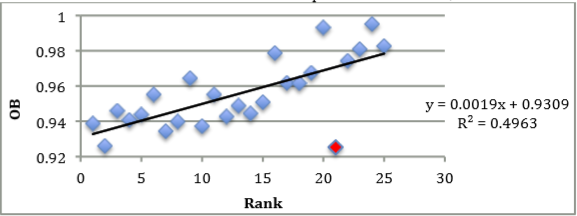
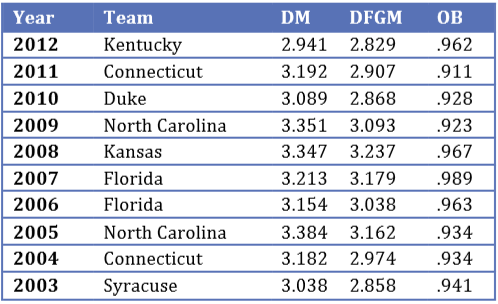
Table 2 contains the OB for each of the last 10 championship teams. While the range of outputs nearly covers the spectrum of possibilities, there has not been a champion recently with as unbalanced an offense as Fredette’s BYU team of 10-11.
A low OB and high rank typically means that the team has an elite offensive player or two. The top teams in this year’s rankings reflect this phenomenon. Gonzaga has Harris and Olynyk. Indiana has Zeller and Oladipo. Duke has Plumlee and Curry. The correlation in Chart 2 shows that the higher ranked the team, the more that team’s offense leans on its couple stars. The one outlier in the data, marked by the red dot, is VCU. If we were to remove VCU, the value of R2 goes to .707.
Table 2: OB for Last 10 Tournament Champions
The VCU Anomaly
In Chart 2, VCU stands out. They have the lowest OB of the group, but are ranked 21st. As discussed above, a high rank and low OB generally means that the team has an elite player or two. Unlike Gonzaga, Indiana, and Duke, VCU does not have any players typically considered to be Wooden Award contenders [3]. Instead, VCU’s position out of position on Chart 2 is a statistical representation of the team’s unique system.
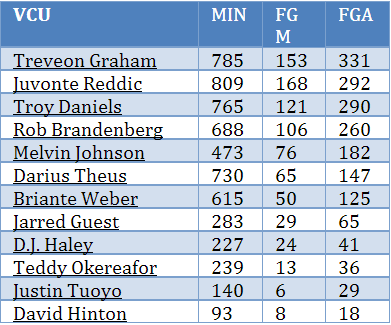
According to [2] “Smart coaches one of the most distinctive styles in NCAA ball.” The article backs up the claim with some statistics. VCU allows only .92 points per possession while scoring 1.13 points per possession. VCU also forces the highest turnover rate in the country. Table 3 contains the minute and field goal data for VCU.
Table 3: VCU Statistics as of March 4, 2013
Future Directions
Next, we would like to understand how OB varies depending on time and score in the game. We suspect that teams generally will have specific players that they look to in clutch time and that OB will drop in these situations. We would also like to study OB in conjunction with other statistics that may help explain why teams are generating high or low OB. Does OB have predictive power? Are certain teams more successful against teams with unbalanced offenses? Finally, we would like to observe OB over more teams across more years, and even in different eras. We would like to know if OB varies greatly depending on the league and level of competition. How would the great Wooden led UCLA teams compare? Does OB generally follow coaches, or is it more dependent on the specific players?
References
[1] Bicker, Jacob and Haff, Katharina. “Measures of Competition and Concentration in the Banking Industry: A Review of the Literature,” Economic and Financial Modeling 2002, Vol. 9, pp. 53-98.
[2] Haley, Jeff. “NCAA Bracket Predictions: Three Final Four Sleeper Picks for 2013.” TEAMRANKINGS.com, March 8, 2013.
[3] King, Jason. “Wooden Award Watch List Announced.” ESPN.com, January 19, 2013.
[4] Shannon, Claude. A mathematical theory of communication. Bell Systems Technical Journal, 27: 379-423, 623-656, 1948; Republished, University of Illinois Press Urbana, IL, 1963.
Printed from TeamRankings.com - © 2005-2024 Team Rankings, LLC. All Rights Reserved.