TeamRankings.com
Get Smart About Sports
October 13, 2020 - by Jason Lisk
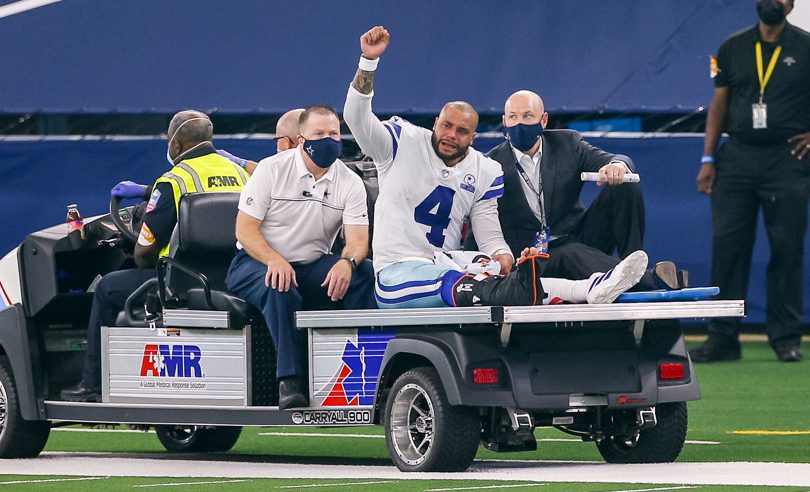
Dak Prescott is done for the year. How will the Cowboys respond? (Photo by Andrew Dieb/Icon Sportswire)
It was an eventful NFL Week 5 to be sure:
Meanwhile, the week is not officially over, as Buffalo and Tennessee still play a rare Tuesday night game. (We will update the numbers in this post on Wednesday after the game).
In this post, we’ll examine not only how teams performed against the point spread and over/under lines in Week 5, but also review some of the fluky, improbable outcomes that can make ATS records misleading.
This level of analysis often provides clues as to which teams may be setting up well to cover the spread in the future.
(To search for your own NFL betting trends, we invite you to use the beta version of our BetIQ Trend Finder Tool.)
Get an edge in your PGA Majors and One And Done pools
Dak Prescott suffered a horrific ankle injury on Sunday, and will be out for the rest of the 2020 season. Through four weeks, Prescott had thrown for more passing yards than any other QB in NFL history. Now, the Cowboys will turn to veteran Andy Dalton at the quarterback position.
How should you value this QB change and how it could impact the Cowboys? You may have seen some people noting that the early look-ahead line for the Week 6 Dallas-Arizona game was Dallas by 3. Now, the line has opened with the Cardinals instead favored by 3. That might lead you to think that Prescott is “worth” 6 points more than Dalton.
But not so fast. Remember that the look-ahead line was also posted before both teams played on Sunday. With Arizona rebounding to beat the Jets by 20 (more than expected), while Dallas barely survived a tight game against the winless Giants, the power ratings for both teams changed as a result. In the end, about 1.6 points of that difference can be attributed to the impact of Week 5 results.
That would imply that the betting market is initially valuing the Prescott loss as being worth closer to 4.4 points.
We’ve seen quite a range in outcomes when franchise quarterbacks have been lost for the season recently. The Lions cratered in 2019 after Matthew Stafford suffered a season-ending back injury, while the Saints went undefeated when Teddy Bridgewater had to play in place of Drew Brees. So both the quality of the backup and the nature of the offense can impact it.
Dalton, while maybe not as good as he was five years ago, is 33 years old and only one year removed from starting for Cincinnati. Dallas also has plenty of offensive weapons at wide receiver, and there are other factors (as we noted last week about Dallas’ fumbles) that suggest there may be some non-QB related reasons to think Dallas is due for some positive regression against the spread.
Some fourth down outcomes led to big swings in Week 5 results, including upsets as well as some favorites holding on to win:
Facing a 4th and 5 at the Pittsburgh 39 and down by 2 points, Eagles head coach Doug Pederson opted for a 57-yard field goal attempt with just over 3 minutes left. It failed, and after taking over near midfield, Pittsburgh scored the sealing touchdown to secure both the win and the cover (Pittsburgh -7). That field goal attempt looks like poor strategy for a number of reasons.
First, the chance of success for a field goal of that length were no better than the chance of converting the fourth down. In 2019, teams converted 7 of 18 field goals of 56 to 58 yards (41%) versus converting 14 of 27 (52%) of 4th-and-5 attempts.
Second, a made field goal to take a one-point lead would have left Pittsburgh with plenty of time and just needing a field goal to win. A fourth down conversion, on the other hand, would have allowed Philadelphia to continue possession and either score a touchdown or kick a shorter field goal, and leave Pittsburgh less time for its last possession in either case.
The Raiders made two key 4th-and-1 calls in their upset of Kansas City. Tied at 24-24 and in field goal range, Derek Carr converted to set up the go-ahead touchdown. Then, just inside the two-minute warning, Carr again converted to seal the victory, rather than punt it back to KC up by 8.
Meanwhile, Patrick Mahomes threw his one interception on 4th-and-7, with the Chiefs down by 9. It was returned near the goal line and set up a touchdown to put the Raiders up by 16 late in the fourth quarter.
Finally, fourth down plays were a massive factor in Seattle surviving against Minnesota to stay undefeated.
With two minutes left, at the Seattle 6, Minnesota went for a 4th-and-1 when up by 5 points to try to seal the victory, rather than go up by 8 points. They were stuffed.
Then, on the ensuing drive, Russell Wilson hit D.K. Metcalf for a big 39-yard gain on 4th-and-10, before throwing the game-winning touchdown on 4th-and-6 with just 20 seconds remaining.
One of the things we are tracking this year is how home teams are performing, with many teams playing in front of no fans to start the year. In Week 5, home teams went 9-5 straight up and 6-8 ATS.
Weekly NFL Home Team Records, 2020 Season To Date
| Week | W | L | T | WIN PCT | ATS W | ATS L | ATS T | ATS PCT |
|---|---|---|---|---|---|---|---|---|
| 1 | 8 | 8 | 0 | 50.0% | 9 | 7 | 0 | 56.3% |
| 2 | 11 | 5 | 0 | 68.8% | 8 | 8 | 0 | 50.0% |
| 3 | 6 | 9 | 1 | 40.6% | 7 | 9 | 0 | 43.7% |
| 4 | 6 | 9 | 0 | 30.8% | 5 | 10 | 0 | 23.1% |
| 5 | 9 | 5 | 0 | 61.5% | 6 | 8 | 0 | 38.5% |
| Overall | 40 | 36 | 1 | 52.6% | 35 | 42 | 0 | 45.5% |
However, last year, home teams were only 43.5% SU and 37.0% ATS in the first five weeks of the season, performing even worse than this year.
Over the previous five seasons (2015-2019), home teams have won 53.5% SU and 46.6% ATS in the first five weeks. So home teams having a sub-50% ATS record so far in 2020 doesn’t buck any recent historical trend.
Here’s how some of the more standard spilts look after Week 5:
TYPE ATS W ATS L ATS T ATS %
Favorites 37 40 0 48.1%
Underdogs 40 37 0 51.9%
Home Teams 35 42 0 45.5%
Away Teams 42 35 0 54.5%
Scoring finally slowed a bit in Week 5 after a steady climb in recent weeks, and Unders hit in 7 of 14 games. Overs are now 43-33-1 on the season (56.5%). In the previous five years, overs hit at a 50.9% rate over the first five weeks.
Here’s a running tally of how overall NFL scoring so far in 2020 compares to the full season averages of recent seasons, based on average total points scored per game:
| 2020 | 2019 | 2018 | 2017 | 2016 |
|---|---|---|---|---|
| 49.4 | 45.6 | 46.7 | 43.4 | 45.6 |
In this section each week, we list a summary of drives that ended with turnovers, but not only official turnovers like interceptions and fumbles.
We also tally up other high-leverage events that likely led to either loss of points or great field position for an opponent. Safeties and blocked punts are included in turnovers, and blocked field goals are included in missed field goal attempts.
Week 5 Team ATS Records Based On Turnovers, Missed Field Goals, and Failed 4th Down Attempts
| Team | Turnovers | FG Miss | Downs | TOTAL | ATS Result |
|---|---|---|---|---|---|
| Jacksonville | 2 | 2 | 1 | 5 | Lost |
| San Francisco | 3 | 0 | 2 | 5 | Lost |
| Cincinnati | 3 | 0 | 1 | 4 | Lost |
| Baltimore | 1 | 1 | 1 | 3 | Won |
| Indianapolis | 3 | 0 | 0 | 3 | Lost |
| Buffalo | 3 | 0 | 0 | 3 | Lost |
| Minnesota | 2 | 0 | 1 | 3 | Won |
| Philadelphia | 2 | 1 | 0 | 3 | Lost |
| Cleveland | 2 | 0 | 0 | 2 | Won |
| Dallas | 2 | 0 | 0 | 2 | Lost |
| Houston | 2 | 0 | 0 | 2 | Won |
| LA Chargers | 0 | 1 | 1 | 2 | Won |
| LA Rams | 1 | 0 | 1 | 2 | Won |
| NY Jets | 0 | 0 | 2 | 2 | Lost |
| Tampa Bay | 1 | 0 | 1 | 2 | Lost |
| Arizona | 1 | 0 | 0 | 1 | Won |
| Atlanta | 1 | 0 | 0 | 1 | Lost |
| Chicago | 1 | 0 | 0 | 1 | Won |
| Kansas City | 1 | 0 | 0 | 1 | Lost |
| Las Vegas | 1 | 0 | 0 | 1 | Won |
| New Orleans | 1 | 0 | 0 | 1 | Lost |
| NY Giants | 1 | 0 | 0 | 1 | Won |
| Pittsburgh | 1 | 0 | 0 | 1 | Won |
| Seattle | 1 | 0 | 0 | 1 | Lost |
| Washington | 0 | 0 | 1 | 1 | Lost |
| Carolina | 0 | 0 | 0 | 0 | Won |
| Miami | 0 | 0 | 0 | 0 | Won |
| Tennessee | 0 | 0 | 0 | 0 | Won |
Teams with 4 or more turnovers, missed field goals or failed attempts went 0-3 ATS.
Teams that had zero drives end in those events went 3-0 ATS, with all three winning outright as underdogs.
Here’s a summary of the full season so far showing the net number of drives ending in turnovers or miscues for each team.
As you might expect, most of the teams at the top have winning records against the spread, while the teams at the bottom have losing records ATS.
2020 Season Summary, Drives Ending in Turnovers or Other Failed Plays
| Team | Mistakes | Opponent | Net | ATS Record |
|---|---|---|---|---|
| Baltimore | 8 | 20 | 12 | 3-2 |
| Seattle | 5 | 16 | 11 | 4-1 |
| Miami | 6 | 15 | 9 | 3-2 |
| Tennessee | 4 | 11 | 7 | 1-3 |
| Pittsburgh | 4 | 11 | 7 | 3-1 |
| Green Bay | 3 | 9 | 6 | 4-0 |
| Kansas City | 6 | 12 | 6 | 3-2 |
| Tampa Bay | 9 | 14 | 5 | 2-3 |
| LA Rams | 9 | 12 | 3 | 3-2 |
| Cincinnati | 9 | 12 | 3 | 3-2 |
| New Orleans | 4 | 7 | 3 | 2-3 |
| Buffalo | 10 | 10 | 0 | 3-2 |
| Atlanta | 10 | 10 | 0 | 1-4 |
| Chicago | 10 | 10 | 0 | 3-2 |
| New England | 10 | 9 | -1 | 2-2 |
| Washington | 12 | 11 | -1 | 1-3 |
| Arizona | 9 | 8 | -1 | 3-2 |
| Cleveland | 10 | 9 | -1 | 3-2 |
| Houston | 8 | 6 | -2 | 1-4 |
| Indianapolis | 10 | 7 | -3 | 3-2 |
| NY Jets | 13 | 10 | -3 | 0-5 |
| LA Chargers | 10 | 6 | -4 | 4-1 |
| San Francisco | 14 | 10 | -4 | 2-3 |
| Detroit | 6 | 2 | -4 | 1-3 |
| Carolina | 8 | 4 | -4 | 3-2 |
| Las Vegas | 8 | 3 | -5 | 3-2 |
| NY Giants | 12 | 7 | -5 | 3-2 |
| Jacksonville | 14 | 8 | -6 | 2-3 |
| Denver | 14 | 8 | -6 | 3-1 |
| Minnesota | 11 | 4 | -7 | 3-2 |
| Philadelphia | 14 | 7 | -7 | 1-4 |
| Dallas | 14 | 3 | -11 | 0-5 |
Finally, here are updated against the point spread and over/under records so far in 2020. You can check out more trends on our BetIQ NFL betting trends page.
2020 NFL ATS and O/U Records
| Team | W | L | T | Streak ATS | Over | Under | Push | O/U Streak |
|---|---|---|---|---|---|---|---|---|
| Arizona | 3 | 2 | 0 | W1 | 0 | 5 | 0 | U5 |
| Atlanta | 1 | 4 | 0 | L3 | 3 | 2 | 0 | U2 |
| Baltimore | 3 | 2 | 0 | W1 | 1 | 4 | 0 | U1 |
| Buffalo | 3 | 1 | 0 | W2 | 3 | 0 | 1 | T1 |
| Carolina | 3 | 2 | 0 | W3 | 2 | 3 | 0 | U3 |
| Chicago | 3 | 2 | 0 | W1 | 2 | 3 | 0 | U2 |
| Cincinnati | 3 | 2 | 0 | L1 | 2 | 3 | 0 | U1 |
| Cleveland | 3 | 2 | 0 | W3 | 4 | 1 | 0 | O4 |
| Dallas | 0 | 5 | 0 | L5 | 4 | 1 | 0 | O4 |
| Denver | 3 | 1 | 0 | W1 | 2 | 2 | 0 | O1 |
| Detroit | 1 | 3 | 0 | L1 | 3 | 1 | 0 | O1 |
| Green Bay | 4 | 0 | 0 | W4 | 3 | 1 | 0 | U1 |
| Houston | 1 | 4 | 0 | W1 | 3 | 2 | 0 | U1 |
| Indianapolis | 3 | 2 | 0 | L1 | 2 | 3 | 0 | O1 |
| Jacksonville | 2 | 3 | 0 | L3 | 3 | 2 | 0 | U1 |
| Kansas City | 3 | 2 | 0 | L1 | 2 | 3 | 0 | O1 |
| LA Chargers | 4 | 1 | 0 | W2 | 2 | 3 | 0 | O2 |
| LA Rams | 3 | 2 | 0 | W1 | 2 | 3 | 0 | U2 |
| Las Vegas | 3 | 2 | 0 | W1 | 4 | 0 | 1 | O1 |
| Miami | 3 | 2 | 0 | W1 | 2 | 3 | 0 | O1 |
| Minnesota | 3 | 2 | 0 | W3 | 3 | 2 | 0 | U1 |
| New England | 2 | 2 | 0 | L1 | 2 | 2 | 0 | U1 |
| New Orleans | 2 | 3 | 0 | L1 | 5 | 0 | 0 | O5 |
| NY Giants | 3 | 2 | 0 | W2 | 2 | 3 | 0 | O1 |
| NY Jets | 0 | 5 | 0 | L5 | 3 | 2 | 0 | U1 |
| Philadelphia | 1 | 4 | 0 | L1 | 3 | 2 | 0 | O1 |
| Pittsburgh | 3 | 1 | 0 | W2 | 3 | 1 | 0 | O3 |
| San Francisco | 2 | 3 | 0 | L2 | 3 | 2 | 0 | O1 |
| Seattle | 4 | 1 | 0 | L1 | 4 | 1 | 0 | O1 |
| Tampa Bay | 2 | 3 | 0 | L2 | 3 | 2 | 0 | U1 |
| Tennessee | 0 | 3 | 0 | L3 | 2 | 1 | 0 | O2 |
| Washington | 2 | 3 | 0 | L1 | 3 | 2 | 0 | U1 |
Get an edge in your PGA Majors and One And Done pools
Printed from TeamRankings.com - © 2005-2024 Team Rankings, LLC. All Rights Reserved.