TeamRankings.com
Get Smart About Sports
September 22, 2020 - by Jason Lisk
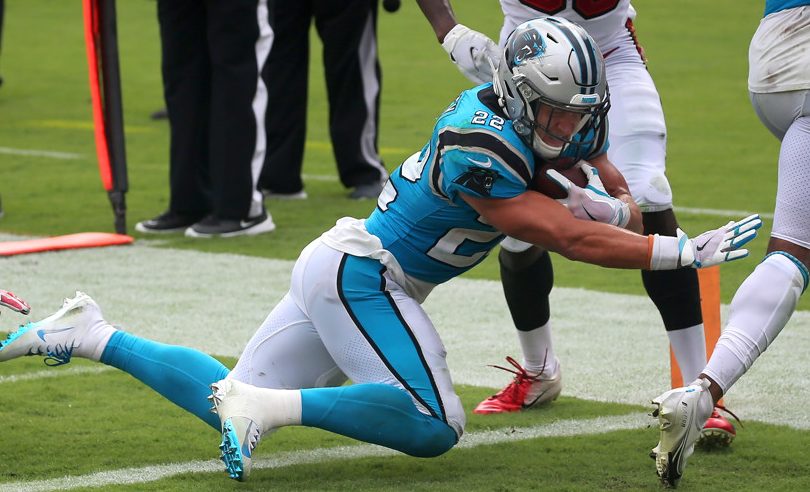
Christian McCaffrey was one of several notable losses in Week 2 (Photo by Cliff Welch/Icon Sportswire)
Unlike a lot of NFL players, this column has survived Week 2 of the 2020 NFL season unscathed. Last week featured no huge upsets but plenty of big-name injuries that could have a longer term impact on teams’ fortunes.
Below you’ll find a breakdown of not only how teams performed against the spread and over/under lines in Week 2, but also an analysis of the more important stuff, such as the fluky plays and highly improbable outcomes that can often make ATS records misleading. Digging beyond simple records often provides clues as to which teams may be setting up well for a future point spread cover.
(To search for your own NFL betting trends, we invite you to use the beta version of our BetIQ Trend Finder Tool.)
Get an edge in your PGA Majors and One And Done pools
Sunday in the NFL featured some near-upsets, but in the end, the only team that was a betting underdog to win Sunday were the Los Angeles Rams. The Rams opened the week as the favorite but ended up as the smallest underdog of the week, with a 45% chance of winning based on betting odds.
So in a week where there were 11 games with teams favored by between 5 and 9 points, we saw no major upsets on the Sunday slate. That changed Monday, when the Raiders, as a 4-point underdog in their Las Vegas home opener, beat the New Orleans Saints 34-24.
The closest games to producing an upset earlier were:
The net result of all these favorites surviving was a 14-2 straight up record for favorites in Week 2, but a 7-9 against the spread mark, as several underdogs covered the number but could not get the victory.
The New York Jets lost 31-13 at home to San Francisco in a game that wasn’t that close, a few days after owner Christopher Johnson praised head coach Adam Gase as a “brilliant offensive mind.”
That marks the second straight week the scoreline is probably generous to the J-E-T-S. Some of the lowlights from Sunday:
Several key injuries happened in Week 2, many of which will have long-term implications and could impact the betting futures outlook for several teams. They include:
One of the things we will track this year is how home teams are performing, with many teams playing in front of no fans to start the year.
In Week 2, home teams went 11-5 SU and 8-8 ATS. That makes home teams 19-13 SU (59.4%) and 17-15 ATS (53.1%) so far in 2020.
Every team in the NFL has now played one home game and one road game. The home teams have been favored, on average, by 1.4 points through the first two weeks, and the average final score margin so far has been +2.8 points in favor of the home team.
Back in the summer, when we analyzed 2020 NFL home field advantage and predicting the impact of reduced crowds, we stated:
In terms of predicting outcomes of NFL games with potentially much smaller or no crowds in 2020, there doesn’t seem to be much evidence warranting a big adjustment to expected home field advantage.
Because the small sample size of 2020 games, we can’t definitively conclude anything yet, but so far home field advantage does not appear drastically different than the aggregate of recent seasons.
For the 2015 to 2019 NFL seasons, the average point spread for Week 1 and Week 2 games was 2.2 points in favor of the home team, and the average result was a home team win by 2.5 points. Home teams won 54.4% of those games straight up and covered the spread 46.9% of the time.
The primary difference so far this year is what appears to be a slight downward adjustment in expected home field advantage, but similar results for home teams (compared to the recent past) to start the season.
In this section each week, we will list a summary of drives that ended with turnovers, but not only official turnovers like interceptions and fumbles.
We also tally up other high-leverage events that likely led to either loss of points or great field position for an opponent. Safeties and blocked punts are included in turnovers, and blocked field goals are included in missed field goal attempts.
Week 2 Turnovers, Missed Field Goals, and Failed Attempts
| Team | Turnovers | FG Miss | Downs | TOTAL | ATS Result |
|---|---|---|---|---|---|
| Carolina | 4 | 0 | 1 | 5 | Loss |
| Dallas | 3 | 0 | 2 | 5 | Loss |
| Denver | 3 | 1 | 1 | 5 | Win |
| Minnesota | 4 | 0 | 0 | 4 | Loss |
| Philadelphia | 3 | 0 | 1 | 4 | Loss |
| Chicago | 2 | 1 | 0 | 3 | Loss |
| Detroit | 1 | 1 | 1 | 3 | Loss |
| Houston | 2 | 0 | 1 | 3 | Loss |
| NY Giants | 2 | 1 | 0 | 3 | Win |
| Pittsburgh | 2 | 0 | 1 | 3 | Loss |
| Cleveland | 1 | 0 | 1 | 2 | Loss |
| Jacksonville | 2 | 0 | 0 | 2 | Win |
| LA Chargers | 1 | 0 | 1 | 2 | Win |
| New England | 1 | 1 | 0 | 2 | Loss |
| NY Jets | 0 | 0 | 2 | 2 | Loss |
| Tampa Bay | 2 | 0 | 0 | 2 | Win |
| Arizona | 1 | 0 | 0 | 1 | Win |
| Buffalo | 1 | 0 | 0 | 1 | Loss |
| Cincinnati | 1 | 0 | 0 | 1 | Win |
| Indianapolis | 1 | 0 | 0 | 1 | Win |
| Las Vegas | 1 | 0 | 0 | 1 | Win |
| Miami | 0 | 0 | 1 | 1 | Win |
| New Orleans | 1 | 0 | 0 | 1 | Loss |
| San Francisco | 1 | 0 | 0 | 1 | Win |
| Seattle | 1 | 0 | 0 | 1 | Win |
| Washington | 1 | 0 | 0 | 1 | Loss |
| Atlanta | 0 | 0 | 0 | 0 | Win |
| Baltimore | 0 | 0 | 0 | 0 | Win |
| Green Bay | 0 | 0 | 0 | 0 | Win |
| Kansas City | 0 | 0 | 0 | 0 | Loss |
| LA Rams | 0 | 0 | 0 | 0 | Win |
| Tennessee | 0 | 0 | 0 | 0 | Loss |
In case you ever doubt how much turnovers and/or other largely random bad luck plays can impact a team’s win-loss and ATS records, take note that most of the teams at the top of the table lost (and failed to cover) while most of those at the bottom won (and covered).
One notable exception in the win column is Dallas, who had 5 drives end in bad mistake outcomes, but rallied to beat Atlanta on a last second field goal after recovering this onside kick attempt.
This is legitimately one of the craziest onside kick mistakes I’ve ever seen in the #NFL. pic.twitter.com/bYk1qoqK7Z
— Charles Robinson (@CharlesRobinson) September 20, 2020
Atlanta is officially down with zero turnovers, missed field goals, or failed fourth down attempts to end drives, so that play isn’t in the official tally but spiritually counts…
Here’s a summary of the full season so far showing the net number of drives ending in turnovers or miscues for each team. As you might expect, several of the teams near the top are 2-0 ATS, while some notable disappointments appear at the bottom of the list.
2020 Season Summary, Drives Ending in Turnovers or Other Failed Plays
| Team | Mistakes | Opponent | Net | ATS Record |
|---|---|---|---|---|
| Baltimore | 1 | 9 | 8 | 2-0 |
| Seattle | 1 | 7 | 6 | 2-0 |
| Green Bay | 1 | 6 | 5 | 2-0 |
| LA Rams | 2 | 7 | 5 | 2-0 |
| Kansas City | 0 | 4 | 4 | 1-1 |
| Pittsburgh | 3 | 7 | 4 | 1-1 |
| Washington | 3 | 7 | 4 | 1-1 |
| Jacksonville | 2 | 5 | 3 | 2-0 |
| New Orleans | 2 | 4 | 2 | 1-1 |
| Chicago | 4 | 5 | 1 | 1-1 |
| Cincinnati | 4 | 5 | 1 | 1-1 |
| Las Vegas | 1 | 2 | 1 | 2-0 |
| NY Jets | 4 | 5 | 1 | 0-2 |
| San Francisco | 4 | 5 | 1 | 1-1 |
| Tampa Bay | 5 | 6 | 1 | 1-1 |
| Tennessee | 3 | 4 | 1 | 0-2 |
| Arizona | 4 | 4 | 0 | 2-0 |
| Atlanta | 5 | 5 | 0 | 1-1 |
| New England | 4 | 4 | 0 | 1-1 |
| Denver | 7 | 6 | -1 | 2-0 |
| Miami | 4 | 3 | -1 | 1-1 |
| Buffalo | 5 | 3 | -2 | 1-1 |
| Indianapolis | 6 | 4 | -2 | 1-1 |
| LA Chargers | 5 | 3 | -2 | 2-0 |
| NY Giants | 5 | 3 | -2 | 1-1 |
| Carolina | 6 | 2 | -4 | 0-2 |
| Detroit | 5 | 1 | -4 | 0-2 |
| Houston | 5 | 0 | -5 | 0-2 |
| Minnesota | 7 | 2 | -5 | 0-2 |
| Cleveland | 8 | 2 | -6 | 0-2 |
| Dallas | 8 | 2 | -6 | 0-2 |
| Philadelphia | 10 | 2 | -8 | 0-2 |
Here’s how some of the more standard spilts look after Week 2:
TYPE ATS W ATS L ATS T ATS %
Favorites 16 16 0 0.500
Underdogs 16 16 0 0.500
Home Teams 17 15 0 0.531
Away Teams 15 17 0 0.469
Here’s a running tally of how overall NFL scoring so far in 2020 compares to the full season averages of recent seasons, based on average total points scored per game:
| 2020 | 2019 | 2018 | 2017 | 2016 |
|---|---|---|---|---|
| 49.4 | 45.6 | 46.7 | 43.4 | 45.6 |
Scoring is up for 2020 so far, topping an average of 50 points scored per game through the first two weeks.
Finally, here are updated against the point spread and over/under records so far in 2020. You can check out more trends on our BetIQ NFL betting trends page.
2020 NFL ATS and O/U Records
| Team | Wins ATS | Losses ATS | Ties ATS | Streak | Over | Under | Push | O/U Streak |
|---|---|---|---|---|---|---|---|---|
| Arizona | 2 | 0 | 0 | W2 | 0 | 2 | 0 | U2 |
| Atlanta | 1 | 1 | 0 | W1 | 2 | 0 | 0 | O2 |
| Baltimore | 2 | 0 | 0 | W2 | 0 | 2 | 0 | U2 |
| Buffalo | 1 | 1 | 0 | L1 | 2 | 0 | 0 | O2 |
| Carolina | 0 | 2 | 0 | L2 | 2 | 0 | 0 | O2 |
| Chicago | 1 | 1 | 0 | L1 | 1 | 1 | 0 | U1 |
| Cincinnati | 1 | 1 | 0 | W1 | 1 | 1 | 0 | O1 |
| Cleveland | 0 | 2 | 0 | L2 | 1 | 1 | 0 | O1 |
| Dallas | 0 | 2 | 0 | L2 | 1 | 1 | 0 | O1 |
| Denver | 2 | 0 | 0 | W2 | 1 | 1 | 0 | O1 |
| Detroit | 0 | 2 | 0 | L2 | 2 | 0 | 0 | O2 |
| Green Bay | 2 | 0 | 0 | W2 | 2 | 0 | 0 | O2 |
| Houston | 0 | 2 | 0 | L2 | 1 | 1 | 0 | U1 |
| Indianapolis | 1 | 1 | 0 | W1 | 1 | 1 | 0 | U1 |
| Jacksonville | 2 | 0 | 0 | W2 | 2 | 0 | 0 | O2 |
| Kansas City | 1 | 1 | 0 | L1 | 1 | 1 | 0 | U1 |
| LA Chargers | 2 | 0 | 0 | W2 | 0 | 2 | 0 | U2 |
| LA Rams | 2 | 0 | 0 | W2 | 1 | 1 | 0 | O1 |
| Las Vegas | 2 | 0 | 0 | W2 | 2 | 0 | 0 | O2 |
| Miami | 1 | 1 | 0 | W1 | 1 | 1 | 0 | O1 |
| Minnesota | 0 | 2 | 0 | L2 | 1 | 1 | 0 | U1 |
| New England | 1 | 1 | 0 | L1 | 1 | 1 | 0 | O1 |
| New Orleans | 1 | 1 | 0 | L1 | 2 | 0 | 0 | O2 |
| NY Giants | 1 | 1 | 0 | W1 | 0 | 2 | 0 | U2 |
| NY Jets | 0 | 2 | 0 | L2 | 2 | 0 | 0 | O2 |
| Philadelphia | 0 | 2 | 0 | L2 | 2 | 0 | 0 | O2 |
| Pittsburgh | 1 | 1 | 0 | L1 | 1 | 1 | 0 | O1 |
| San Francisco | 1 | 1 | 0 | W1 | 1 | 1 | 0 | O1 |
| Seattle | 2 | 0 | 0 | W2 | 2 | 0 | 0 | O2 |
| Tampa Bay | 1 | 1 | 0 | W1 | 2 | 0 | 0 | O2 |
| Tennessee | 0 | 2 | 0 | L2 | 1 | 1 | 0 | O1 |
| Washington | 1 | 1 | 0 | L1 | 1 | 1 | 0 | U1 |
Get an edge in your PGA Majors and One And Done pools
Printed from TeamRankings.com - © 2005-2024 Team Rankings, LLC. All Rights Reserved.