TeamRankings.com
Get Smart About Sports
September 2, 2020 - by Jason Lisk
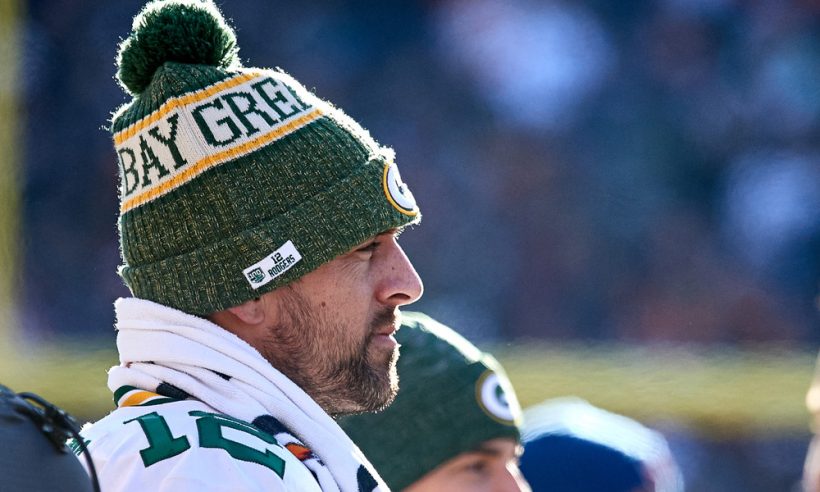
Aaron Rodgers ponders how he can totally mess up our preseason ratings by requesting a trade (Photo by Robin Alam/Icon Sportswire)
This post describes our methodology and process for creating NFL preseason rankings for all 32 teams.
We’re data people, so as one should expect from TeamRankings, our NFL preseason rankings are primarily driven by stats and modeling and not less objective methods like film study or media scouting reports.
(That’s not to broadly denigrate more subjective methods of analysis. But when it comes to preseason NFL rankings, many narratives exist that aren’t supported by hard data.)
Before we dive into the details of our approach, let’s first cover a few basics.
Get an edge in your PGA Majors and One And Done pools
It’s important to know that our preseason rankings simply represent the rank order of preseason predictive ratings that we generate for every NFL team.
So the first step in our process is to calculate preseason team ratings.
In simple terms, an NFL team’s predictive rating is a number that represents the margin of victory we expect when that team plays a “perfectly average” opponent on a neutral field.
This rating can be a positive or negative number; the higher the rating, the better the team. A rating of 0.0 indicates a perfectly average team.
NFL Betting and Pool Picks:
Football Pick’em Picks | NFL Survivor Picks | NFL Betting Picks
Because our NFL predictive ratings are measured in points, the difference in rating between any two teams indicates the projected winner and margin of victory in a neutral-site game between them.
For example, our system would expect Kansas City, which has a 2020 preseason rating of 8.1, to beat an average NFL team by about eight points on a neutral field.
It would expect Kansas City to beat Las Vegas, which has a -2.2 rating, by about 10 points on a neutral field. And Las Vegas would be expected to lose to an average team by about two points.
Understanding the nature of a predictive rating is helpful, because it is more precise than a ranking.
For example, Ravens fans may cringe to see Kansas City ranked No. 1 in our 2020 preseason rankings. However, Baltimore’s predictive rating is 7.8, only 0.3 points lower than Kansas City’s rating.
So yes, if you put a gun to our head and told us to rank order every team, we’d say Kansas City is going to be a better team than Baltimore this season. But the difference is so small that it’s practically meaningless. When Kansas City travels to play Baltimore in September, and a home field advantage of multiple points applies, our preseason ratings would favor Baltimore to win.
Now take Tampa Bay, which sits at No. 5 in our 2020 preseason rankings. The distance between Tampa Bay and the Kansas City Chiefs is 4.7 ratings points. To find a team that is rated at least 4.7 points worse than Tampa Bay, though, you have to drop all the way down to No. 23 Arizona. So while the Bucs appear in the top five, they are closer to a whole host of teams in the middle of the pack.
In short, don’t place too much stock in a team’s ranking. Ratings tell the more refined story.
Once the season starts, our predictive ratings go on autopilot. As game results from NFL Week 1 and beyond come in, our system automatically adjusts team ratings (and the resulting rankings) within a few hours of receiving a new box score.
Teams that win by more than the ratings had predicted see their ratings increase. Teams that suffer worse than expected losses see their ratings drop. Software code controls all of the adjustments and no manual intervention is required.
Generating preseason ratings, however, involves a more labor-intensive process that we go through before every new season starts. In short, we are trying to pre-calibrate our NFL predictive ratings system. We want to give it a smarter starting point than simply having every team start the season with a 0.0 rating, because it’s almost certain that every
Put another way, our preseason ratings are our first prediction of what we think every NFL team’s predictive rating will be at the end of the upcoming season. And we need to make that prediction before any regular season games are played.
Despite being a substantial challenge from a data perspective, our approach to this process is still mostly data-driven and objective. However, there are some judgment calls incorporated, which we’ll explain below.
Before we get into the details, it helps to explain a brief history of how and why our current preseason ratings process evolved:
Why we took that final step is simple. Generating preseason team ratings using a customized model significantly improved the in-season game predictions made by our NFL ratings — and not only in early season games, where one would logically expect to see the biggest improvement.
In fact, still giving the preseason ratings some weight even at the very end of the season improved our prediction performance over the final weeks too.
During every offseason, we first put in work to improve our preseason ratings methodology. We investigate new potential data sources and refit our preseason ratings model using an additional year of data.
After implementing any offseason refinements to our process and model, we then gather the necessary data and generate our preseason ratings for the upcoming season. We typically complete this process a week or two before the NFL regular season starts.
Now, let’s get to the meat. By analyzing years of NFL data and using more than a decade of recent season results, we’ve identified a short list of descriptive factors that have correlated strongly with end-of-season team power ratings.
We use a regression model to determine each factor’s weight in our preseason ratings. As a result, the relative importance of each factor is based on its demonstrated level of predictive power.
The statistical bar for giving a specific metric the nod as having predictive power is very high, and most stats don’t make it in. But here are some of the factors we do incorporate, and will briefly explain below:
(By the way, all of these stat factors are based on past “regular season plus postseason” numbers. We don’t incorporate any game results or stats from NFL preseason games into the model.)
How good a team was in the most recent season — as measured by end-of-season predictive rating and not win-loss record — is the single best objective measure of how good that team will be in the upcoming season.
The year-to-year correlation coefficient for our predictive rating is +0.45. In non-stat geek terms: no other factor we’ve investigated comes close to being as important as this one.
That said, other factors do contribute to the final 2020 preseason rating of each NFL team.
This factor measures how good a team has been in recent history, not including the previous season.
Since each NFL regular season only includes 16 games, capturing more games further in the past still has some relevance. A team may have had an injury-filled season or just an unlucky year, and looking to the deeper past can distinguish that team from another that has been consistently bad for several years.
So what happened two or three years earlier still has some relationship to this year’s preseason rating. The impact on preseason ratings isn’t nearly as strong as the most recent season, since a lot of the info conveyed by the older ratings is already conveyed by the rating from last season. But it still has some predictive power.
(For the statisticians in attendance, the correlation between final predictive ratings in a given year and those from two seasons earlier is 0.33. The correlation with ratings from three seasons earlier is still 0.22.)
Our quarterback factor accounts for both how good a team’s quarterback is and, to a lesser extent, whether that’s an improvement or a decline from past seasons. (Note that this a change from past seasons. Prior to 2020, the QB component only reflected how a team’s quarterback contribution was expected to change compared to past seasons, and not the absolute level of quarterback performance.)
To create this factor, we first identify the likely starting quarterback (or quarterbacks, if there isn’t a clear top starter) for each team, and make a projection of their performance based on a weighted average of their recent stats. For rookies, we use a simple model based on their draft position and college passer efficiency rating to project their NFL performance. For players that have suffered injuries or missed time for other reasons, we regress their raw stats toward their career averages and/or their rookie projections.
This is the core of the QB component. You might wonder if this gives teams “extra credit” for returning a good quarterback. After all, isn’t that player’s good performance already captured in the Last Season Performance component?
Well, it turns out that when we include projected QB performance in the model, the weight of the Last Season Performance component decreases. Essentially, part of the “credit” for the previous power rating is now being assigned to the quarterback.Consider a case of two good teams with identical ratings, one of which is driven by great QB play, and the other by great defensive play covering for a mediocre quarterback. In our model, the team with the star quarterback would have a higher predicted rating the following season, all else being equal.
The model is essentially saying that quarterback performance is more consistent than most other aspects of team performance.
This component reflects the expected change in team rating due to (surprise!) luck-related factors. Several stat categories are highly impacted by luck, or not very reproducible for other reasons.
For example, it’s become fairly common knowledge in recent years — at least among those who closely follow statistical football analysis* — that turnovers in the NFL have a large component of randomness associated with them.
Some years, when defensive backs tip passes and running backs drop balls on the turf, a team just happens to have a lot of lucky bounces go its way. Other years, the opposite happens. These types of things will never be highly controllable or predictable.
As a result, turnover luck tends to regress toward average from one season to the next. Less commonly known, however, is that there are also some defensive stats that act in much the same way (third down conversion rate being one of them).
*Note: At least one former NFL head coach vehemently disagrees. In fact, he got into a heated lunch discussion about it several years back with our 20-year old intern, who didn’t even make his high school football team but politely refused to back down from his data-driven position. It was quite amusing.
Hope all is well, coach Mangini.
This factor relates to recent changes in coaching, and what has tended to happen historically in similar scenarios. It is not a measure of how good or bad a coach is.
In other words, don’t look at New England getting a -0.1 coach rating in 2020 and think we are crazy. We agree Bill Belichick is a great head coach, but factors related to New England’s previous season performances already measure the general impact of his coaching prowess.
This metric measures projected changes in coaching impact. For example, historically, teams that perform very poorly in a given year tend to improve the next year under a new, first-year NFL coach. Hence Carolina’s positive coaching adjustment in 2020 with Matt Rhule.
However, most first-year NFL coaches get a negative coaching adjustment, because our research shows that unless a team was quite bad the previous year, it usually sees a decline during the inaugural year of a new head coach.
For second-year coaches, the opposite is true. Overall, second-year coaches tend to show an improvement in team performance, and you can see that relationship reflected in our 2020 ratings.
However, the second-year head coach effect is again not uniform. In this case, it’s the coaches that delivered at least a respectable, and maybe even an improved first season that see the biggest increases in rating contribution.
Doug Pederson, for example, won a Super Bowl in his second season in Philadelphia, after the team showed positive improvement in his first year as coach.
After our model generates its 100% data-driven NFL preseason ratings, we then run a series of season projections (simulating the regular season and the playoffs 10,000 times) and compare the distribution of outcomes in our simulations to the betting markets.
If our assessment of a specific team seems way out of whack in comparison to the market, we’ll investigate more. Primarily, we’re looking to identify some factor not taken into account by our model (e.g. a major injury, notable personnel changes, or a very unique coaching situation) that is likely to impact the expected performance level of a team.
In most of those cases, we end up adjusting a team’s rating to be closer to the market. As a result, this final part of the process does inject some subjective judgment calls into our process.
It typically takes a good amount of convincing for us to incorporate some level of subjectivity into a prediction process.
With only 32 teams and a 16-game NFL season, though, there’s a lot of uncertainty to deal with. As we mentioned earlier, there’s a very high statistical bar to reach in order to anoint a particular stat as predictive of future team performance, and very few stats pass the test.
That’s a good thing. One of the biggest challenges of predictive modeling is filtering out the signal from the noise, and “false positives” based on small sample sizes can ruin the future accuracy of a model.
At the same time, lots of different factors are still likely to impact the future performance of a particular team in some significant way. But until we have a large enough sample size of similar events to analyze, it would be very risky to incorporate even a promising-sounding factor into our model.
Especially in more outlier-type cases, our best solution for the foreseeable future may be to make manual adjustments to incorporate the opinion of the betting markets.
As a final point, it’s important to remember that predicting how good an NFL team will be before the season starts is one area where the betting market has proven to be a good predictor overall, as one would expect. But that doesn’t mean it’s perfect.
And while our methodology has its blind spots, it is rooted in a level of statistical rigor that goes significantly beyond what most other rankings makers apply. So while we do make some subjective final adjustments, even in most outlier cases we don’t often adjust our numbers to exactly match the market.
This year, for example, the biggest market adjustment we made was for Jacksonville. The Jaguars were a below average team both last year and the year before, after a run to the AFC title game in 2017 (was it really only three years ago?). But Jacksonville was not historically bad in either of those seasons. They finished the 2019 season 24th in our predictive ratings, and were 21st in 2018.
Based on historical data alone, we would expect that the Jaguars would be a below average team, but not the worst team in the league. The market, though, has them as the lowest projected win total in the NFL, even playing in an AFC South division that lacks a clear title contender. In short, the market has them as the worst team in the NFL entering 2020.
Jacksonville has had a lot of player turnover and has been jettisoning talent over the last 18 months. Almost every star defensive player from that AFC Championship team is now gone. They are changing their offensive approach, and recently cut running back Leonard Fournette. They are expected to be positioning themselves to have a high draft pick in 2021. Some of that large-scale talent loss is not being picked up by our models, so we recognize that there’s probably some merit in this particular case to moving the Jaguars down.
That said, even after giving Jacksonville by far the largest market adjustment downward, we still have them even with Washington as the lowest rated team, and not clearly below everyone else. We also have them projected for more wins (5.1) than the market has for their win total (4.5).
There are many different ways to make preseason rankings for the NFL. The approaches can vary greatly, from media power rankings to “expert” analysis, from building complex statistical models to making inferences from futures odds in the betting markets.
And speaking frankly, there’s plenty of crap out there. But there’s also no Holy Grail (yet).
Within ten seconds of looking over our preseason NFL rankings, you’ll probably find several rankings you disagree with, or that differ from what most other “experts” or ranking systems think. That’s to be expected.
When the dust settles at the end of the season, our NFL preseason ratings, and the various projections we generate using them, will almost certainly be way off for a few teams. As happens every year, some teams simply defy expectations thanks to surprise breakout performances (looking at you, Mr. Mahomes!), while other teams are impacted by injuries, suspensions and other unanticipated events.
Nonetheless, the primary goal of our preseason analysis is to provide a baseline rating for each team (or “prior” in statistical terms) that makes our system better at predicting regular season NFL games. We’re most concerned about the overall accuracy of the system — that is, how good it is at predicting where every predictive rating for every NFL team will end up at the end of the upcoming season.
For that purpose, we’ve settled on a mostly data-driven (but still subjectively adjusted) approach to preseason team ratings. And so far, this approach has delivered very good results.
If you’re in an NFL pool or betting games this season, check out our Football Pick’em Picks, NFL Survivor Picks, and NFL Betting Picks.
Printed from TeamRankings.com - © 2005-2024 Team Rankings, LLC. All Rights Reserved.