TeamRankings.com
Get Smart About Sports
August 30, 2019 - by David Hess
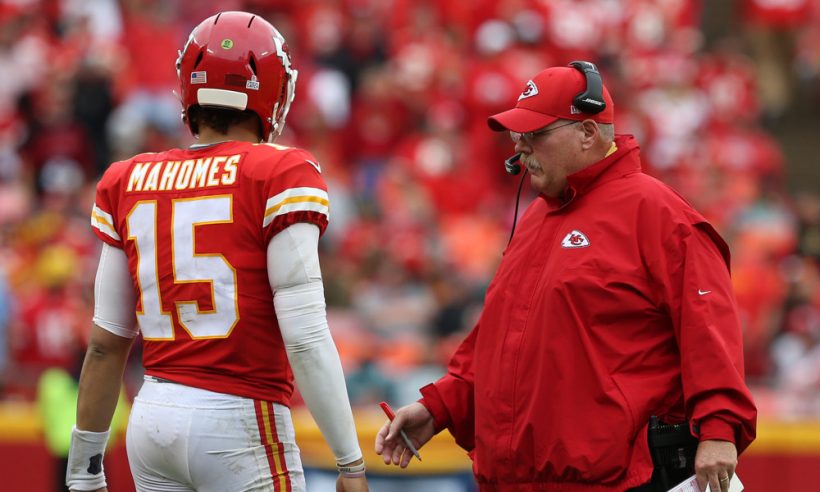
The Kansas City Chiefs are projected to be the top offense in 2020, to the surprise of many (Photo by Scott Winters/Icon Sportswire)
The official 2019 NFL preseason rankings and predictive ratings from TeamRankings have arrived.
If you’d like to learn about the methodology behind our mostly data-driven preseason team ratings, make sure your read our post on how we make NFL preseason rankings.
To see the 2019 rankings, keep reading to find out how good (or bad) we expect all 32 NFL teams to be this year.
Get an edge in your PGA Majors and One And Done pools
NFL Betting and Pool Picks:
Football Pick’em Picks | NFL Survivor Picks | NFL Betting Picks
The table below shows our 2019 preseason ranking of all 32 NFL teams, along with each team’s associated preseason predictive rating (e.g. 5.6 for Kansas City).
The team ratings are expressed as points better (positive rating) or worse (negative rating) than a “perfectly average” NFL team, when playing on a neutral field.
The final seven columns of the table show the relative contribution of specific factors our preseason ratings model considers, as well as a final “market adjustment” we make for each team. We’ll explain these factors below.
| TR Rank | Team | 2019 Rating | LAST YEAR | FRANCHISE | QB | LUCK | DRAFT | COACH | MARKET |
|---|---|---|---|---|---|---|---|---|---|
| 1 | Kansas City Chiefs | 5.6 | 4.4 | 1.1 | 0.5 | -0.2 | -1.0 | -0.1 | 1.0 |
| 2 | New England Patriots | 5.4 | 3.5 | 2.7 | -0.3 | 0.0 | -0.4 | -0.1 | 0.0 |
| 3 | New Orleans Saints | 5.2 | 4.5 | 1.9 | -0.2 | -0.5 | -0.4 | -0.1 | 0.0 |
| 4 | Los Angeles Chargers | 4.5 | 2.9 | 0.8 | -0.3 | 0.0 | 0.7 | -0.1 | 0.5 |
| 5 | Los Angeles Rams | 3.9 | 3.9 | 0.7 | 0.2 | -1.3 | -0.6 | -0.1 | 1.0 |
| 6 | Philadelphia Eagles | 3.2 | 1.1 | 2.5 | 0.0 | 0.4 | -0.7 | -0.1 | 0.0 |
| 7 | Pittsburgh Steelers | 2.7 | 2.6 | 1.3 | -0.4 | 0.1 | -0.3 | -0.1 | -0.5 |
| 8 | Chicago Bears | 2.1 | 2.9 | -1.0 | -0.5 | -1.3 | 0.3 | 1.7 | 0.0 |
| 9 | Green Bay Packers | 1.8 | -1.2 | -0.1 | 1.1 | -0.1 | -0.2 | -0.7 | 3.0 |
| 10 | Atlanta Falcons | 1.7 | -0.2 | 1.9 | -0.5 | 0.8 | -0.3 | -0.1 | 0.0 |
| 11 | Houston Texans | 1.7 | 1.6 | -1.5 | 1.5 | -1.6 | -0.2 | -0.1 | 2.0 |
| 12 | Seattle Seahawks | 1.5 | 2.0 | 0.6 | -0.3 | -1.0 | 0.4 | -0.1 | 0.0 |
| 13 | Minnesota Vikings | 1.5 | 0.3 | 1.6 | -0.8 | 0.4 | -0.4 | -0.1 | 0.5 |
| 14 | Baltimore Ravens | 1.4 | 3.0 | 0.7 | -0.8 | 0.2 | 0.5 | -0.1 | -2.0 |
| 15 | Dallas Cowboys | 1.0 | 0.6 | 0.9 | -0.3 | -0.4 | 0.3 | -0.1 | 0.0 |
| 16 | Cleveland Browns | 1.0 | -0.2 | -3.0 | 2.7 | -1.4 | 1.7 | -0.5 | 2.0 |
| 17 | Carolina Panthers | 0.5 | -1.7 | 0.9 | -0.2 | -0.2 | -0.2 | -0.1 | 2.0 |
| 18 | Tennessee Titans | 0.3 | 0.1 | -0.8 | 0.0 | 0.0 | 1.4 | 0.6 | -1.0 |
| 19 | Jacksonville Jaguars | 0.3 | 0.3 | 0.8 | 0.7 | 0.5 | 0.0 | -0.1 | -2.0 |
| 20 | San Francisco 49ers | 0.1 | -2.8 | -1.5 | 1.2 | 2.0 | 0.4 | -0.1 | 1.0 |
| 21 | Indianapolis Colts | -0.8 | 1.9 | -2.0 | -1.7 | -0.4 | -0.3 | 1.7 | 0.0 |
| 22 | Denver Broncos | -1.8 | -0.3 | -0.9 | 0.3 | -0.7 | 0.0 | -1.1 | 1.0 |
| 23 | Tampa Bay Buccaneers | -1.9 | -1.4 | -0.3 | -0.6 | 1.0 | 0.1 | -0.7 | 0.0 |
| 24 | Detroit Lions | -2.0 | -1.5 | 0.2 | -0.3 | -0.1 | -0.4 | 0.1 | 0.0 |
| 25 | New York Jets | -2.7 | -3.7 | -1.6 | -0.2 | 1.4 | 0.1 | 0.3 | 1.0 |
| 26 | Buffalo Bills | -2.8 | -3.2 | -0.7 | -0.3 | 0.7 | -0.2 | -0.1 | 1.0 |
| 27 | Oakland Raiders | -4.0 | -4.5 | -0.6 | -0.3 | 0.5 | -0.3 | -0.3 | 1.5 |
| 28 | New York Giants | -5.1 | -1.1 | -1.5 | -0.4 | 0.3 | 0.0 | 0.1 | -2.5 |
| 29 | Washington Redskins | -5.5 | -2.4 | -0.2 | -1.1 | -0.6 | -0.1 | -0.1 | -1.0 |
| 30 | Arizona Cardinals | -5.7 | -5.7 | -0.7 | 1.6 | 0.6 | -1.1 | 1.1 | -1.5 |
| 31 | Cincinnati Bengals | -5.8 | -1.8 | -1.0 | -0.2 | -0.2 | -0.1 | -0.6 | -2.0 |
| 32 | Miami Dolphins | -7.6 | -4.2 | -1.4 | -0.7 | -0.5 | 0.3 | 0.4 | -1.5 |
Using a training data set composed of the 2006 to 2018 NFL seasons, we’ve identified and valued team-level stats that are highly correlated with success in an upcoming NFL season.
Just as importantly, we’ve worked to identify and ignore information that isn’t impactful. You can build all sorts of qualitative narratives that attempt to presage why an NFL team might be good or bad this season (very experienced QB, great draft class, new coach, etc.). But often times, theories like these aren’t confidently substantiated by historical data-based testing.
(For example, we have not found a strong correlation between the quality of a team’s most recent draft class and its upcoming season performance. However, the quality of draft classes three and four years ago does make a difference, presumably because it takes a few years for most talented rookies to develop into higher performers.)
While we encourage you to read our full preseason rankings methodology, here’s a quick explanation of the factors we currently use in our NFL preseason ratings:
(Note: These factors are not the same as the factors that drive our 2019 preseason college football rankings.)
Certain factors used by our preseason ratings model are worth more than others, as you can see from the above table. For example, last season’s performance level (LAST YEAR) tends to be the best predictor of how a team will do this season.
In comparison, how a team has done over a longer period of recent history (FRANCHISE) — more a measure of the consistent quality of the coaching staff, and a team’s general prowess at restocking and developing talent — also has a predictive impact. But its correlation with upcoming season performance generally isn’t as strong as LAST YEAR.
MARKET, the lone subjective factor of the bunch, varies from team to team. We make final ratings adjustments based on team-specific factors that likely represent blind spots in our current algorithm. This factor deserves an appropriate explanation, which you can also find in our preseason rankings explanation post.
Let’s use No. 16 Cleveland as a quick example of our MARKET adjustment. Cleveland’s profile is a mix of extreme good and bad elements, plus one major factor that’s really tough to quantify.
Here’s what’s bad:
Here’s what’s good:
Cleveland’s profile is already pretty unusual, but we haven’t even gotten to the toughest part, the coaching change.
The COACH component basically sees a decent team last season that replaced their coach. Typically, there’s a slightly negative impact on the next season when a decent team changes coaches.
However, our model doesn’t take into account that last year included a half-season of Hue Jackson, who may register as one of the worst head coaches in recent NFL history.
So the Browns’ specific (perhaps unrepeatable) coaching profile is pretty unique. Few teams had a dysfunctional coaching situation, fired their head coach mid-season, started playing a lot better, and then promoted the offensive coordinator to head coach after the No. 1 pick at quarterback made great strides under him.
That’s not a situation that has an identifiable and sufficient historical sample size of clearly-similar events. Asking “So what’s happened in the past in many cases like this?” simply isn’t possible.
For outliers like Cleveland in 2019, we believe the betting market will do at least as good a job of projecting the “Coach Kitchens Impact” as we can. As a result, we simply make a judgment call to adjust Cleveland’s predictive rating significantly toward the market consensus.
Here are some other observations and notes from our preseason rankings:
The Patriots have been our projected No. 1 team in over half of the seasons that we’ve been making preseason ratings. New England also won the Super Bowl after being our preseason No. 1 last year. Both QB Tom Brady and coach Bill Belichick return in 2019 to torment the rest of the AFC.
So why isn’t New England No. 1 again? Mainly because:
The LA Rams and LA Chargers both rank in our preseason top five, but you might be surprised to see the Chargers ahead of the Rams, despite the Rams being better last season. That’s mainly for two reasons:
New England is a perennial title contender, and the Patriots have won the AFC East in 15 of the last 16 years. According to our ratings, 2o19 doesn’t look like the year that’s going to change.
New England’s division opponents (the Buffalo, the NY Jets, and Miami) all rank a woeful 25th or worse in our preseason rankings. The Jets and Bills are only “normal” bad; if it catches a few breaks during this year, either of those teams could exceed expectations and end up being at least average.
The Dolphins, on the other hand, look like they’ll need to conjure up some serious magic to just to rise above the NFL’s bottom five by season’s end.
You might notice that the Green Bay Packers get a boost in the QB category. Aaron Rodgers, though, isn’t exactly new to Green Bay.
The only teams with higher quarterback bumps make sense: Cleveland (Mayfield), Arizona (Murray), San Francisco (a hopefully healthy Garoppolo), and Houston (Watson entering year three, typically a time of performance elevation).
So why does Green Bay get that boost?
It’s not because of the Packers’ new offensive system and coaching change; this factor doesn’t measure impact in those specific areas. (Read our How We Rank NFL Teams post for more on that.) Rather, you can thank Brett Hundley. This metric looks at a team’s average QB performance over the last few years, so Hundley’s play in 2017 games factor into the baseline. A healthy Rodgers in 2019 should improve on that baseline.
Some people get quite worked up about preseason NFL rankings — especially when our approach seems to think their favorite team is going to be worse than the prevailing consensus.
That’s to be expected. No one else ranks teams exactly like we do, and our approach often discounts the impact of things that many media analysts and football “experts” believe to be important.
We also have a very specific goal for our preseason NFL team ratings, which relates to predicting the margins of victory of future NFL games. That goal doesn’t line up exactly with the motivations of many other rankings makers.
Just keep in mind that predicting how 32 different NFL teams are each going to do this season, before any of them have played a regular season game, is no easy task. No system is perfect, including ours. It has strengths and weaknesses. We expect to get some teams slightly wrong, and some other teams very wrong, for a variety of reasons.
But in the longer term, our approach has done very well when measured by the yardstick that means the most to us: the overall accuracy, across the entire universe of 32 NFL teams, of projecting team performance levels at the end of the upcoming season.
Finally, please remember to look at team ratings and not just rankings, because ratings tell a much more precise story.
For example, in 2019, only 0.3 ratings points separate No. 1 Kansas City from No. 3 New Orleans, but 0.7 points separate No. 7 Pittsburgh from the No. 4 LA Chargers.
In other words, New Orleans is closer to being No. 1 than No. 4.
So don’t overreact to a team’s ranking number. Look at the rating as well, and you’ll be able to tell which generally expected performance tier a team is in.
If you’re in an NFL pool or you’re betting games this season, check out our Football Pick’em Picks, NFL Survivor Picks, and NFL Betting Picks.
Printed from TeamRankings.com - © 2005-2024 Team Rankings, LLC. All Rights Reserved.