How We Won The Sloan Sports Analytics Conference NFL ATS Pick’em
January 10, 2012 - by David Hess
Some of you have probably heard of the MIT Sloan Sports Analytics Conference (#ssac). It’s held every year in Boston, and features presentations by some of the biggest names in sports analysis, plus it’s a great chance to network for anyone NOT giving a talk.
Among the participants last year were John Hollinger, Mark Cuban, Henry Abbott, Daryl Morey, Dean Oliver, Bill Simmons, and the Scorecasting guys.
This year to help hype the conference, SSAC sponsored a Football Pick’em Challenge, which invited anyone thinking of attending SSAC to compete in a season long NFL ATS pick’em contest.
The Contest
The rules were simple: pick every NFL game against the spread set by Yahoo, throw out your worst week, and the person with the most correct picks wins.
As for the prize, the organizers were nice enough to throw a bone to a dog, offering to knock 50% off the price of admission for the winner.
We felt this type of contest was right down our alley, and would be a good chance to prove our strategy works, even against some people who are likely on the smarter end of the sports spectrum, so we entered the pool.
Our Approach
We treated this contest just as we advised everyone to approach spead-based pick’ems in our preseason pick’em strategy blog series. That is, we made sure to take advantage of soft lines!
Unlike real gambling markets, where lines continually update based on betting trends, injuries, and other new info, the lines for an ATS pick’em are generally frozen a few days prior to game day. That means that when it comes time to make a pick, the current Vegas line could differ from the official contest line.
OK, so how did we use that info to our advantage?
We started with our NFL ATS picks as our base, and applied a simple rule of thumb: 1 line point = 3% Odds. For every “free point” we were getting on our official ATS pick, we added 3% to our confidence. For every point that we were giving to the market, we subtracted 3% (and yes, we also adjusted for half points).
Let’s look at a concrete example. Right now our ATS pick for Broncos at Patriots is Denver +13.5, with 53.9% confidence. Let’s say the official contest line, though, is Denver +12. In that case, the math would go like this:
(contest line – current market line) * 3% + TeamRankings ATS Odds = new odds
(12 – 13.5) * 3% + 53.9% = 49.4% Denver +12
Since our projected odds for Denver at +12 are below 50%, our pick becomes the Patriots.
The Result
So, how did we do?
As you might guess from the fact we’re writing this post, pretty darn well!
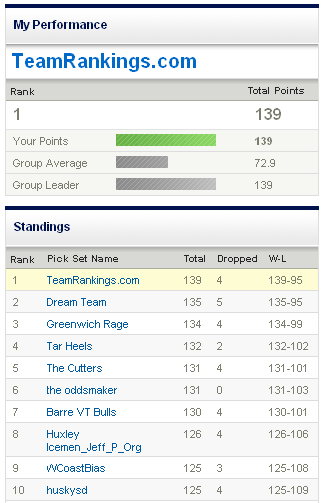
Nearly halfway through the season, after Week 7, we were sitting down at 19th out of 87 entries, 8 games out of first place. However, we went 93-60 (61%) the rest of the way, and a big Week 16 (13-3) essentially locked it up for us. When the dust settled, we were 4 games clear of the field:
We’re thrilled to have come out on top, both because it demonstrates our strategy works well, and because with the discount, we may end up sending multiple members of the team to Boston for the conference! [EDITOR’S NOTE: Hey, David, not so fast there. : ) ]
Thanks again to Sloan for sponsoring the conference and the contest. We’ll see you at SSAC!
Printed from TeamRankings.com - © 2005-2024 Team Rankings, LLC. All Rights Reserved.
