2012 NFL Preseason Rankings Breakdown: How Each Factor Impacted Each Team
September 4, 2012 - by David Hess
Are you wondering why we projected the San Francisco 49ers to decline by several wins in 2012? Or why we think the Eagles are a good bet to top the NFC East rather than the defending Super Bowl champion Giants?
Well, we’re here to tell you. Just as we did with our 2012 college football preseason rankings, and in the interest of full disclosure, here are all of the components that went into our 2012 NFL preseason rankings.
Preseason Ratings Methodology
We create our preseason ratings by examining the historical record, and using a technique called regression to map out relationships between A) variables that we can measure going into the season, and B) team ratings at the end of the year. Translation: We do a bunch of research to figure out what stats, as of the preseason, actually seem to make a difference in a team’s future performance.
For example, the data shows us that the more recent high draft picks a team has, the better they tend to do. It also shows that teams with a very high positive turnover margin tend to get worse the next year. That first claim is probably common sense. The second one? Not so much, although a lot of people are aware of it by now.
Other factors that we’ve found to be important include how a team’s projected starting quarterback compares to their QB from the past few seasons, and a team’s end of season ratings from the past few years, not just the most recent season.
Probably the most important thing about our preseason ratings, however, is not what they include — it’s what they don’t include.
We look at a lot of factors, many of which your average NFL fan would logically think are going to make an impact on a team in the upcoming season. However, many of these logical theories fail the math test. That is, we either don’t have enough historical data to substantiate a significant impact, or we do, but contrary to conventional wisdom, the impact is actually not significant.
So we ignore them, which is often times much less dangerous than trying to wildly guess at what the effect of Team X hiring offensive coordinator So-And-So will be.
For more info on how we arrived at the factors we do use, see our original post on how we create our preseason ratings.
NFL Preseason Rating Factors
But just saying “these factors are important” isn’t really an explanation. So, we’ve decided to show you exactly how much each factor contributed to a team being ranked where they are.
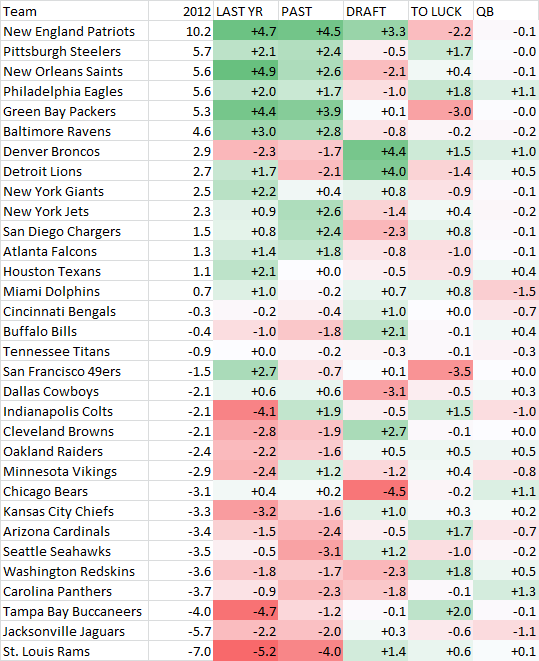
The table below lists every NFL team, along with their 2012 preseason power rating, and a breakdown of how that 2012 rating moved from 0 (exactly average, and the starting point for all teams) to its final value.
Each column is one category that factors into our preseason ratings. The value shown for a team is how many points they gained in that category, relative to a completely average team. If you add up all the categories, you get the team’s 2012 preseason rating.
Here’s a brief definition of each category:
LAST YR — last year’s final predictive power rating;
PAST — weighted average of a team’s predictive power rating from the previous few years; gives a general sense of overall franchise strength, and helps alleviate the impact of “fluke” years;
DRAFT — value of high-round draft picks from recent years (does not try to project specific players, just uses their draft order); maturation of young draft picks has been an important factor in predicting performance;
TO LUCK — teams with high turnover margins in one year tend to get worse the next; teams with negative turnover margins tend to get better;
QB — bonus/penalty given when the weighted average recent QB rating for a a team’s projected starting quarterback is better/worse than the QB rating of the team’s actual past quarterbacks; helps account for teams’ QB changes; a simple QB rating projection is used for rookies.
2012 NFL Preseason Rating Component Values

As you can see, our relatively low rating of the 49ers is partly a result of their recent poor performance history farther back than 2011, but mostly on their crazy-good turnover margin last season. As much as you may love Jim Harbaugh, who’s to say that last year wasn’t at least partially a fluke? If you’re trying to come up with a prediction for the 49ers this year, and your starting point is their record last year, that’s already a risky assumption.
As for the Bears, another team whose TR prediction elicits groans from their loyal fans, they basically have empty high-round draft classes in 2009 and 2010 to blame for most of their low rating. Maybe there is something special about the Bears that will render that adjustment imprudent this year, and Chicago will significantly outperform our projection. Sure, it could definitely happen. They would be bucking history, though.
The bottom line is, none of these factors are guarantees that any given team will do better or worse than average. They’re just trends, but they are statistically significant and well-supported by hard data. Overall, the aggregate results of these projections should outperform the vast majority of humans at the exercise of predicting end of season records for all 32 NFL teams this year.
Are you surprised at any of these values, or at the relative importance of each category? Let us know what you think in the comment section below.
Printed from TeamRankings.com - © 2005-2024 Team Rankings, LLC. All Rights Reserved.