TeamRankings.com
Get Smart About Sports
March 16, 2016 - by Seth Trachtman
Here at TeamRankings, we’ve developed a sophisticated solution of strategy plus technology for winning NCAA bracket pools. From the minute the 2016 NCAA bracket was announced on Selection Sunday, we’ve been making our objective predictions for the NCAA tournament by gathering and analyzing many sources of data on every team. These include:
Late last night, we fed our data-driven predictions, along with the latest data on public picking trends in this year’s bracket pools, to a server farm of 18 high-powered computers over at Amazon. Overnight and through today, those computers have been running software we wrote to perform millions of simulations of the 2016 NCAA tournament, as well as simulations of fictional bracket pools of different sizes and scoring systems.
The end results are our official 2016 NCAA bracket picks (check them out here): simulation-tested brackets that are algorithmically optimized for your pool’s size and scoring system.
Last year, based on an analysis of how our picks did in over 1,300 different bracket pools, customers using our brackets won prizes up to 5 times as often as you’d expect from an average opponent in their pool.
Objective data is the heart and soul of our bracket pick optimization process, and since we spend a bunch of time gathering and reviewing team ratings data from multiple different sources, we figured we’d publish some of the highlights.
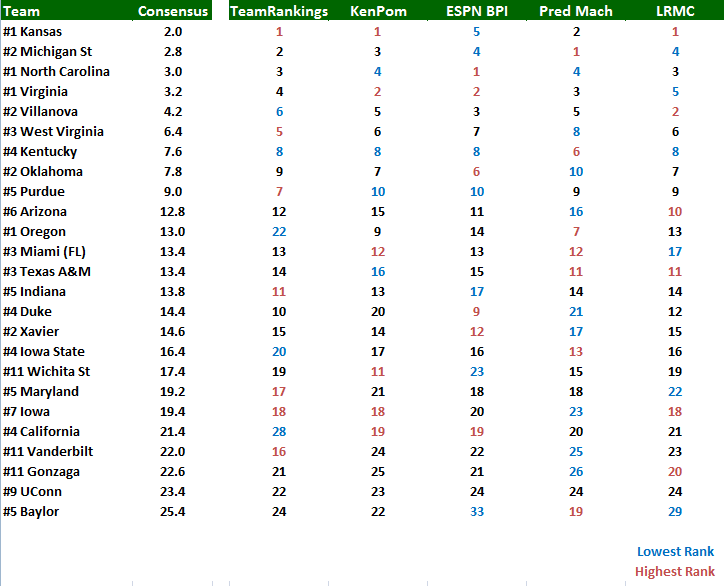
The table below represents data from five sources:
The table gives you a quick visual sense of where each team is ranked, and of the level of agreement between different ratings systems. We’ve included the top 25 teams in the 2016 NCAA tournament, as measured by average ranking (not rating) across all five systems (the “Avg.” column). Just click on the image to enlarge it.
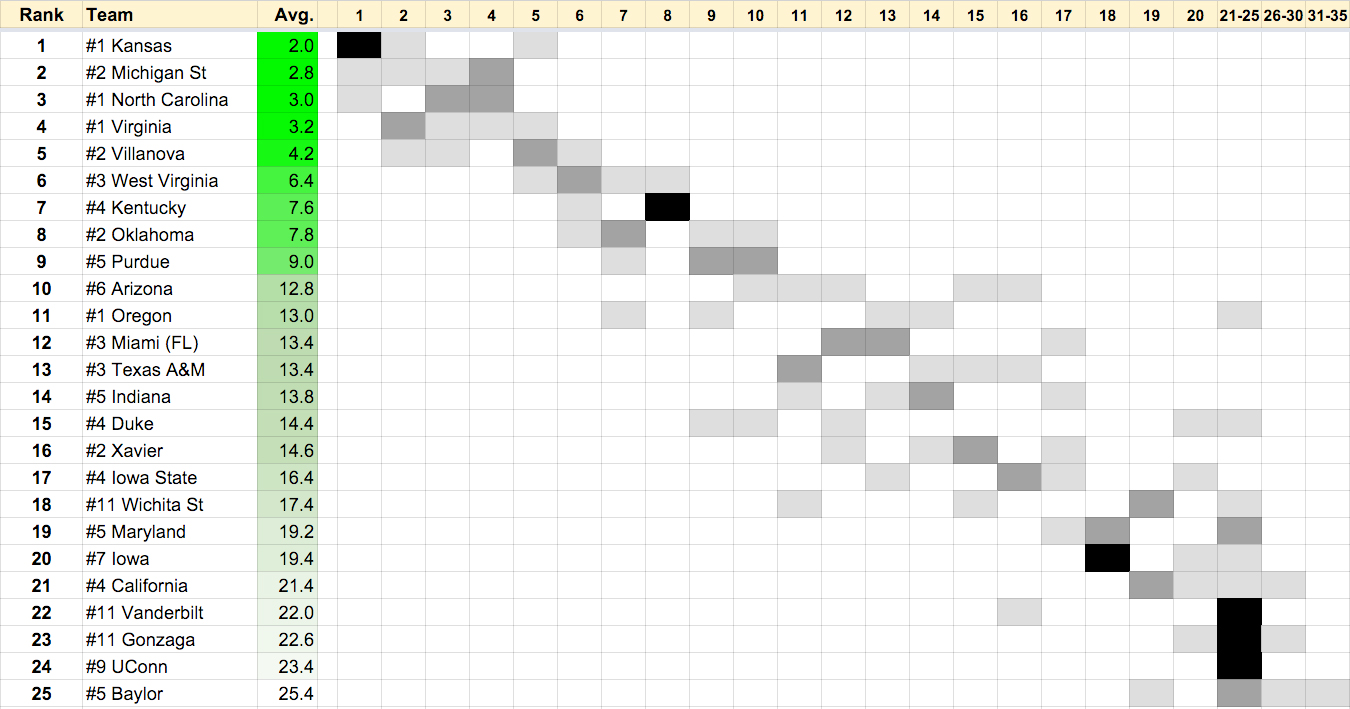
(Note that postseason-banned teams Louisville and SMU were eliminated from these rankings, so the teams behind them moved up one or two spots as a result in each ranking.)
Here’s the full set of data that the chart was based on. We evaluated all of these data points, and thousands more, as part of our process to give you the best chance to win your NCAA pool.
Printed from TeamRankings.com - © 2005-2024 Team Rankings, LLC. All Rights Reserved.