TeamRankings.com
Get Smart About Sports
March 15, 2015 - by Tom Federico
Here at TeamRankings, we’ve developed a sophisticated strategy for winning NCAA bracket pools that relies on several different sources of input data to predict every team’s chances. The end result is our official 2015 NCAA bracket picks.
Since we spend a bunch of time on Selection Sunday gathering and reviewing team ratings and projections from different sources, we figured we’d publish some of the comparative highlights.
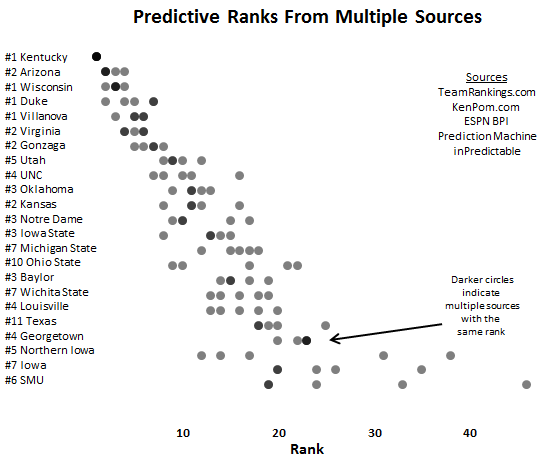
The chart below represents data from five sites: TeamRankings.com, Ken Pomeroy, ESPN’s BPI, PredictionMachine, and inPredictable.
We’ve plotted each site’s ranking (not rating) of each of the teams below as a gray dot. If multiple sites have a team at the same rank, the dot is darker. (That’s why Kentucky has just one really dark dot; the Wildcats are unsurprisingly ranked #1 by all five systems.)
All teams in the top 20 on any of the sites are included. Reflecting the great deal of consensus across these models, that represents only 23 teams.
Looking at the chart, we can see:
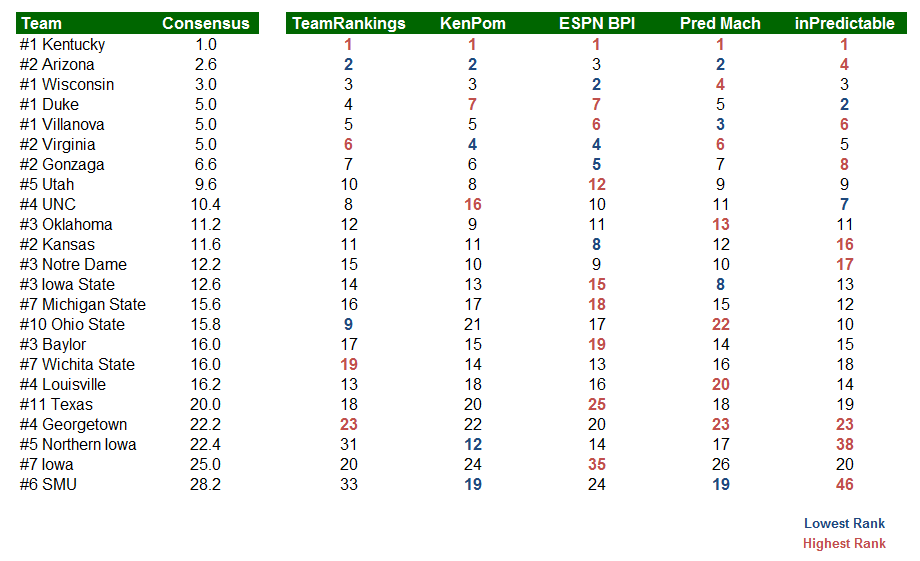
Here’s the full set of data that the chart was based on. We evaluated all of these data points, and thousands more, as part of our process to give you the best chance to win your NCAA pool.
Printed from TeamRankings.com - © 2005-2024 Team Rankings, LLC. All Rights Reserved.