The Importance Of Seeding (Part 1): Three Factors That Make Seeding More Important Than You Realize
February 21, 2012 - by Monte McNair
[This article is a part 1 of a 2-part guest post conceived of and written by Monte McNair. Part 2 can be found here. Monte analyzes both college basketball and college football at his blog Outside The Hashes, can be found on Twitter at @OTH_blog, and was a member of the 2012 Stat Geek Mock NCAA Tournament Selection Committee.]
With a month left in the season, most of college basketball is focused on who’s in and out of the tournament. Those teams near the cut line are on the Bubble, while teams that are securely in the tournament are Locks with little worry of falling out of the bracket and seemingly little left to gain with their dance cards punched.
Turns out, there’s still plenty to play for, especially at the top. As every fan knows, the NCAA Tournament is seeded from 1 to 16 in four separate regions. The top seeds are rewarded by being placed at locations close to home, protected from a home-crowd disadvantage, and–most importantly–pitted against easier opponents.
That last point is even more pronounced than one might expect. Obviously every team wants to move up a seed line, but the importance of climbing each rung of the seeding ladder might surprise.
Factor #1: Uneven Distribution of Team Strength
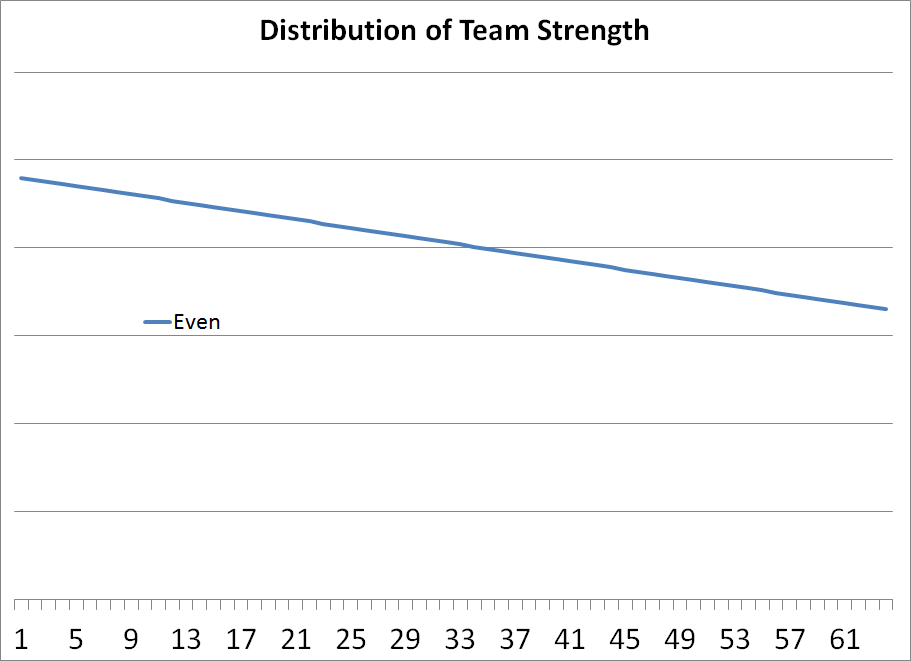
Let’s assume that the quality of teams is evenly distributed such that the difference between the best team and the 2nd-best team is the same as the difference between 2nd and 3rd and between 9th and 10th and between 63rd and 64th, and so on. If we graphed that, we’d get a straight line, sloping downwards, like this:
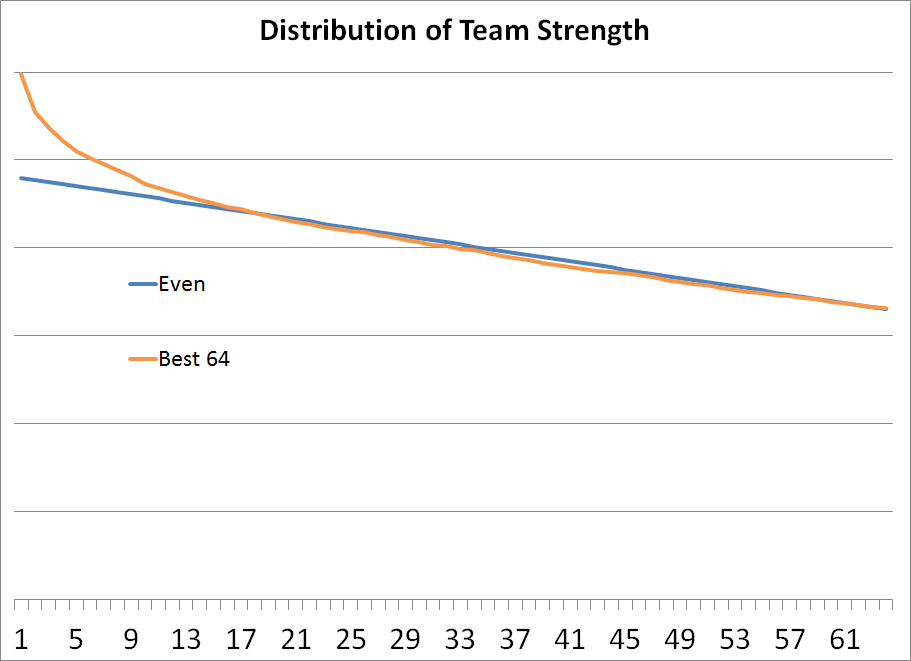
However, the teams aren’t quite distributed evenly. The best teams are a clear cut above the rest. Let’s look at how the best 64 teams are actually distributed:
The top teams increasingly put more room between them and the team below them, before it flattens out around the 15th-best team.
What this means is that avoiding the top teams is imperative. In an even distribution, playing the #1 and #50 teams would be about the same as playing the #25 and #26 teams. However, in reality, playing the #1 and #50 teams is much more difficult due to the quality of the best teams.
Factor #2: Automatic Bids Dilute The Field
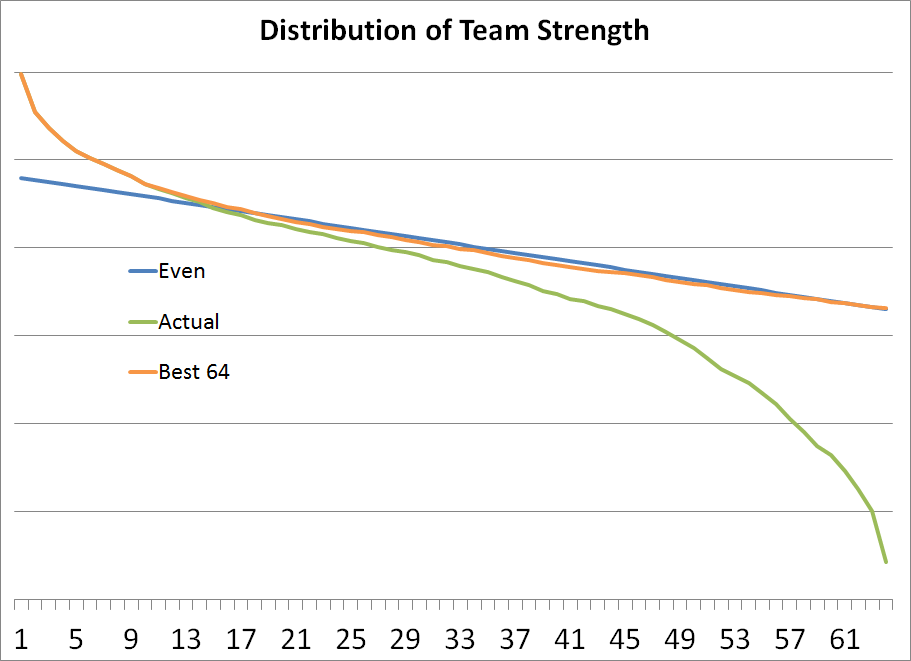
We’re not done yet, there’s one more wrinkle and that is the NCAA policy of granting an automatic bid to each conference champion. The tournament therefore ends up with not the 64 best teams but with the best 45-50 teams and then a group of weaker conference winners.
There are actually two things going on with the green line, which graphs the actual 64 tournament teams. First, in the middle of the graph, there is a slight separation due to some of the at-large bids not going to the actual strongest teams (due to teams underachieving, or whatever the case may be).
Second is the more important piece: the tail at the end of the graph is the one-bid conference automatic winners. These are the teams that occupy the 13th through 16th seed lines.
I think you can see where this is going: grabbing one of those top seeds really helps a team by giving them a 1st-round game against a much weaker opponent.
Factor #3: The Selection Committee Makes Mistakes
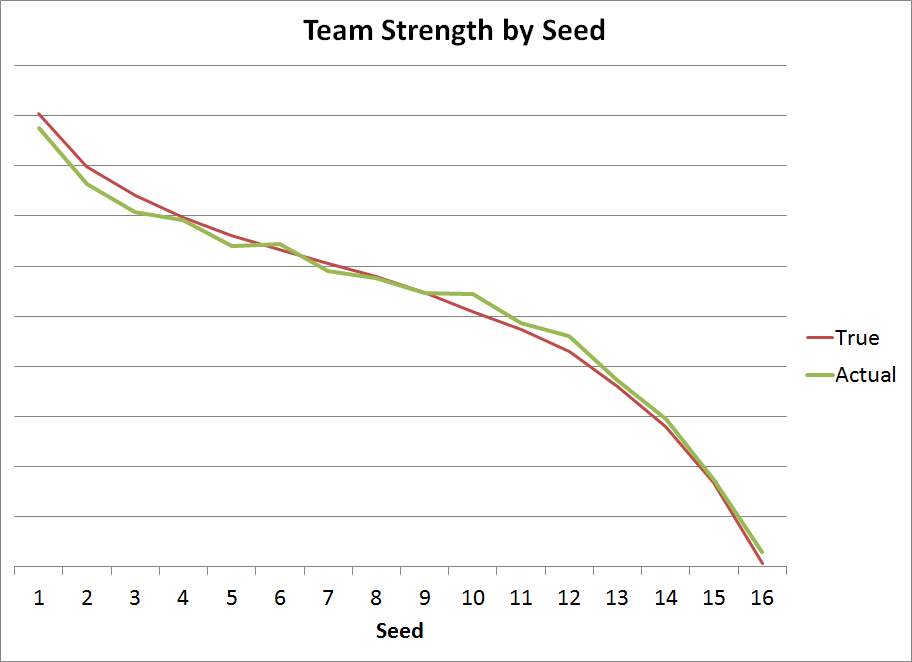
So we’ve identified two big reasons why seeding is not uniform: drawing the weaker automatic bids and avoiding the best teams are of increased importance. Before, we go any further, let’s look at how strong the teams at each seed line actually are.
For the same reasons that we saw the slight drop off in the green line above, teams won’t be seeded exactly according to their true strength. This will push teams somewhat towards the middle.
The red line is team strength if the seeding were “true”, meaning the 4 best teams were seeded #1, the next 4 #2, and so on. The green line, showing the average team strength by a team’s actual seed, shows a slight push towards the middle with the top seeds being a little worse than expected and the bottom seeds slightly better.
It turns out this effect is minimal, meaning teams are generally seeded pretty close to their true strength. The selection committee does a pretty decent job at seeding — at least when you average things out over the long haul. Any given team could still be much higher or lower than deserved.
Putting It All Together: Path Difficulty
What does this all mean about a team’s chances of advancing based purely on their seed?
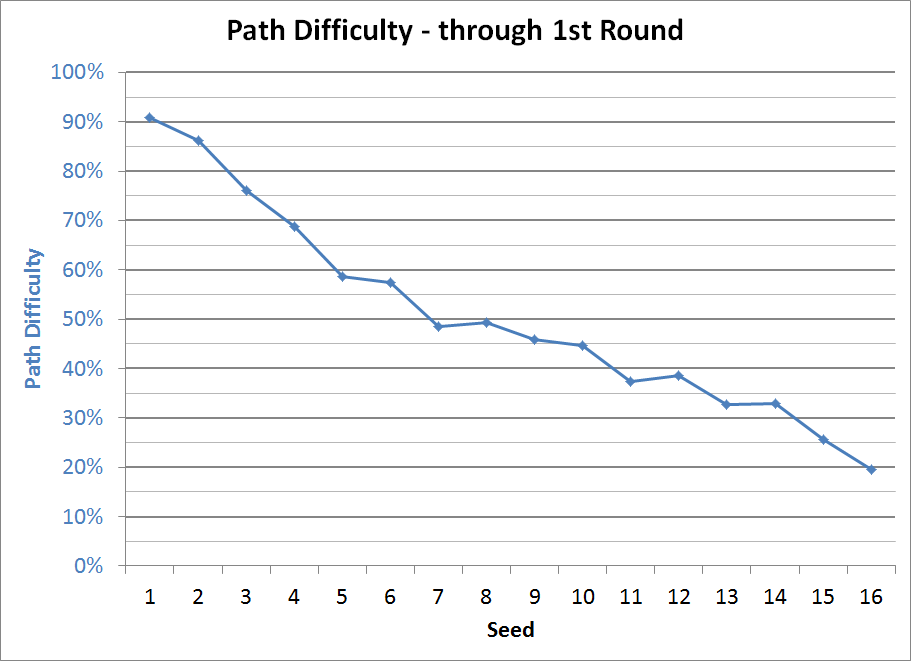
To determine that, I calculated a Path Difficulty for each team by looking at their potential opponents in each round, weighting by the likelihood of each opponent making it to that round (for instance, if you’re an 8-seed across from #1 seed Kentucky and #16 seed Texas Southern, both of them are potential 2nd-round opponents, but clearly Kentucky is much more likely to be your opponent), and then calculating the probability of an average tournament team winning that game.
The easiest way to think about Path Difficulty through a certain round is that it is the chance of an average tournament team advancing past that round given that team’s path. Let’s start with the first round. This is pretty easy, as the only factor is your opponent. As we expect, the chart matches the previous graph of team strength by seed.
What do the second and later rounds look like? They’re a bit more complicated, since teams are no longer matched up against a single opponent.
Come back tomorrow to see how skewed the curves get, especially for the #8 and #9 seeds.
Printed from TeamRankings.com - © 2005-2024 Team Rankings, LLC. All Rights Reserved.
