TeamRankings.com
Get Smart About Sports
March 14, 2015 - by Aaron Barzilai
It’s that most wonderful time of the year: March Madness, when all of America obsesses over the NCAA Tournament.
By now, the media, coworkers, family, friends and frenemies alike have inundated you with all things March Madness. Articles, tweets, and raging diatribes on the NCAA bracket hit you from all angles — and everyone wants you to enter their bracket pool.
To commemorate the madness this year, we’re doing something new. Using unique data we’ve collected about our customers’ bracket contests, we’re going to share and celebrate all of the amazing varieties of NCAA bracket pools that are out there.
Hopefully, you’ll get some fun new ideas for how to set up your own bracket pool in 2015.
Because when it comes to dreaming up ways to reallocate wealth during March Madness, you all are some seriously creative people. Or just plain insane.
Since the prehistoric age of 2000, we’ve pioneered the concept of data-driven bracket picks here at TeamRankings. In recent years, though, we’ve made big leaps forward in the sophistication and scope of our bracket pick analytics.
Today, we ask customers of our bracket picks product for specific details about their pools: the number of entries, the scoring system, the payout structure. Then, we take that data and customize brackets that give each user the best chance to win his or her specific bracket pool.
(In short, few people realize just how much factors like scoring system and pool size affect optimal pick strategy in NCAA pools. And thanks to millions of bracket pool simulations that we run, we’re the only ones who can customize a great bracket for thousands of different pool variations, in seconds.)
For the first time, though, we’re going to share some of the bracket pool data we collected from our customers last year. We took a sample of a few thousand pools, so while the following data may not be exactly representative of all bracket pools in the world, it’s a sufficient amount of information for a high-level study.
Digging through our data, we took a look at the distribution of how large NCAA Tournament pools are in terms of entries. Looking at the chart below we can see:
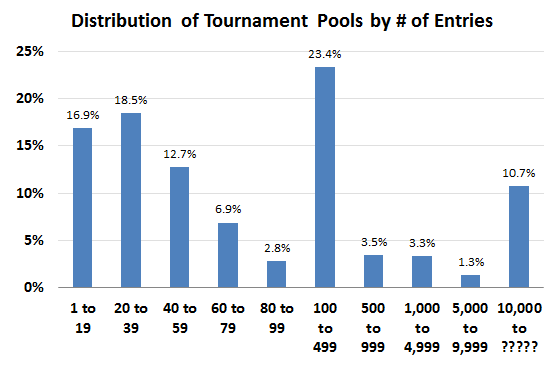
“10,000 or more” was the largest pool size option we gave our customers last year, so it’s not exactly clear what’s driving the relatively big volume of pools at the high end of the pool size range.
We suspect that some of it came from customers entering the Warren Buffett / Quicken Loans billion dollar bracket challenge, or putting entries into the general national contests on big sites like Yahoo! and ESPN.
It also illustrates a quirk in our data set. It’s highly doubtful that 11% of pools nationwide have at least 10,000 people in them, so at larger pool sizes, we almost certainly had a good number of customers all entering some of the same pools. At small pool sizes, this phenomenon should be rare, though.
(By the way, at very large pool size, even though your chances of winning are quite low, your expected long-term profit goes up significantly if you enter portfolios of multiple brackets all with different champions. So we hope those customers all used the “Play Multiple Entries” brackets we include in our NCAA bracket picks product.)
Summing up a few of the bins in the above chart in a slightly different way, we find out that:
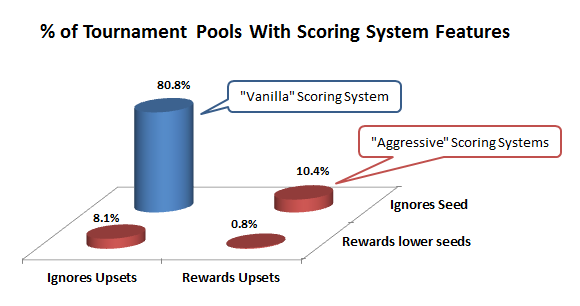
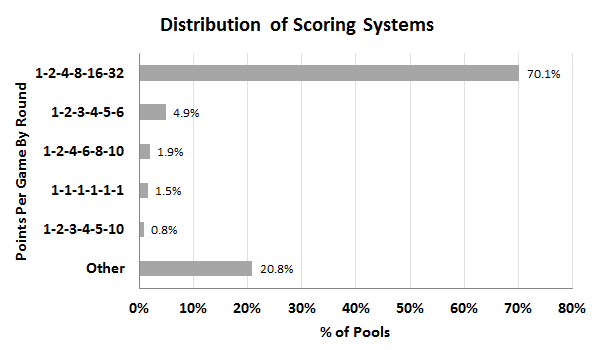
If there is one theme from the data in our system, it’s that bracket pool commissioners are very, very creative. Last year our customers, in aggregate, used our product to get customized brackets for over 500 different unique variations of scoring systems.
We can’t possibly detail all the variations, but we’ve provided a summary below.
We also looked at how bracket pools pay out money to winners. (Oops did I just say that? Sorry, I meant “how pools distribute bragging rights for entertainment purposes only.”)
Continuing our theme of lots of creativity, our data set of customer bracket pools from 2014 included over 120 different prize structures.
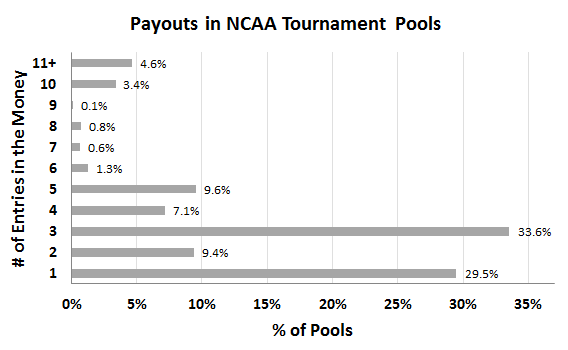
When it comes to divvying up the greenbacks the day after the NCAA tournament champion is crowned, the pools in our data set split winnings among recipients in a wide variety of ways.
We also looked at the most common payout splits based on the number of entries receiving a prize. For example, in pools where two finishers won prizes, the most common pot split percentage was 75% to first place and 25% to second. Here’s a bigger list:
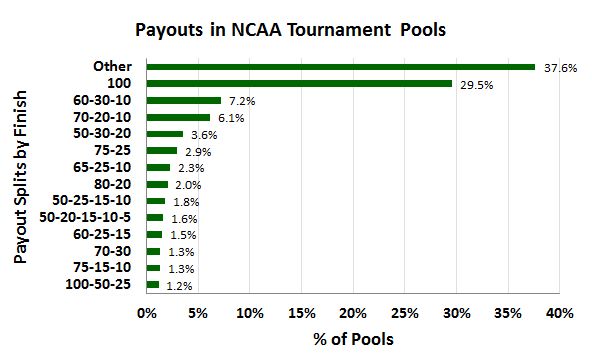
Note that “100” in the chart above represents winner take all.
The overwhelming majority of NCAA tournament pools in our data set did not include the play-in games (sorry, “First Four”), but did include all remaining rounds of the NCAA tournament.
Still, our tools do support pools that count the play-in games, as well as pools that begin with the Sweet 16. As a result, we know that:
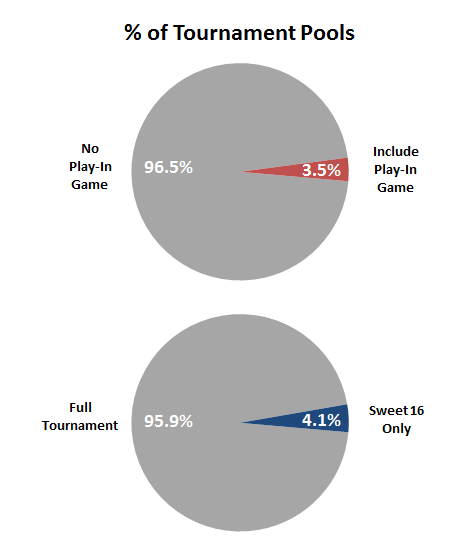
Since Sweet 16 pools and pools that included the play-in games were rare, we did not include data from them in any of the other numbers we quote in this post.
As our customer data shows, pool commissioners set up NCAA bracket pools in a dizzying variety of ways, and that’s yet another reason that makes March Madness so awesome.
It also makes our job — analyzing all these bracket pool variations and training a gaggle of high powered servers over at Amazon Web Services to figure out how to get the biggest edge in every one of them — quite amazingly complicated. But we love the challenge.
Good luck putting together a fun bracket pool in 2015. And if you want the number crunchers from TeamRankings to help you get the maximum edge in your pool, our picks are here.
Printed from TeamRankings.com - © 2005-2024 Team Rankings, LLC. All Rights Reserved.