TeamRankings.com
Get Smart About Sports
October 23, 2015 - by Seth Trachtman
A solid Week 7 using my Patriots stack along with DeAndre Hopkins, and I’m back on track.
I only entered four double up tournament contests last week, playing it safe with a very conservative lineup. Judging by my rank, I finished somewhere around the 70th percentile of entries, comfortably in the money for contests that pay out to the top 45%.
My results so far:
| Week | # Contests Entered | Total Entry Fees | Total Prize Winnings | Net Gain/Loss for Week | Finals Tickets Won | Cumulative Profit | Cumulative Finals Tickets Won |
|---|---|---|---|---|---|---|---|
| 1 | 5 | $32 | $327 | $295 | 4 | $295 | 4 |
| 2 | 9 | $82 | $0 | ($82) | 0 | $213 | 4 |
| 3 | 5 | $45 | $29 | ($16) | 1 | $197 | 5 |
| 4 | 5 | $45 | $0 | ($45) | 0 | $152 | 5 |
| 5 | 4 | $40 | $0 | ($40) | 0 | $112 | 5 |
| 6 | 4 | $35 | $70 | $35 | 0 | $147 | 5 |
Sports stats trends can change gradually, and fantasy owners have to adjust to those changes. The salary caps in FanDuel also require us to evaluate and reevaluate player values. Six weeks into the regular season, it’s a good exercise to see how the early season compares to 2014. The question is: should strategies should be adjusted based on the performances (and salaries) thus far?
To investigate this, I looked at points scored per dollar of salary at the four skill positions:
The results:
Quarterback
| Max | Top 10 | Top 20 | Top 30 | |
|---|---|---|---|---|
| 2015 Increase | 25.86% | 17.32% | 13.62% | 13.18% |
| 2015 | 0.003064474 | 0.002725576 | 0.002519123 | 0.002345738 |
| 2014 | 0.002434884 | 0.002323203 | 0.002217164 | 0.002072536 |
Running Back
| Max | Top 10 | Top 20 | Top 30 | |
|---|---|---|---|---|
| 2015 Increase | 20.09% | 0.64% | 2.17% | 5.65% |
| 2015 | 0.002990805 | 0.002214193 | 0.002036297 | 0.001890126 |
| 2014 | 0.002490385 | 0.002200067 | 0.001993103 | 0.001789103 |
Wide Receiver
| Max | Top 10 | Top 20 | Top 30 | |
|---|---|---|---|---|
| 2015 Increase | 9.32% | 17.91% | 16.40% | 5.19% |
| 2015 | 0.002521739 | 0.002305267 | 0.002142591 | 0.001852631 |
| 2014 | 0.002306742 | 0.001955064 | 0.001840715 | 0.001761297 |
Tight End
| Max | Top 10 | Top 20 | Top 30 | |
|---|---|---|---|---|
| 2015 Increase | 23.65% | 14.59% | 12.20% | 10.47% |
| 2015 | 0.002394915 | 0.002056182 | 0.001783962 | 0.001527573 |
| 2014 | 0.001936842 | 0.001794315 | 0.001590054 | 0.001382754 |
We’ve seen a very similar increase in dollars per point at every position except for running back. It’s unclear if this is because FanDuel isn’t adjusting salaries on the same scale as the other positions, or the other positions are just blowing out expectations.
Either way, it’s clear based on the numbers that we’re getting more bang for the buck from quarterback, wide receiver, and tight end than we were last season. Quarterback, in particular, is looking like a great investment relative to the other positions.
Playing the safe lineup worked out well last week, so I’m at it again. I played a safe stack last week (Tom Brady and Julian Edelman), and I’m unintentionally trying that again with a pair of Cardinals.
To review my normal strategy:
The highest Vegas-implied point totals this week include:
| Team | Vegas-Implied Points |
|---|---|
| Arizona | 29.0 |
| Indianapolis | 28.0 |
| New England | 28.0 |
| Atlanta | 25.8 |
| San Diego | 25.0 |
The lowest Vegas-implied point totals include:
| Team | Vegas-Implied Points |
|---|---|
| Cleveland | 17.5 |
| Baltimore | 19.0 |
| Tampa Bay | 19.8 |
| Kansas City | 20.0 |
| NY Jets | 20.0 |
Here’s my lineup for Week 7:
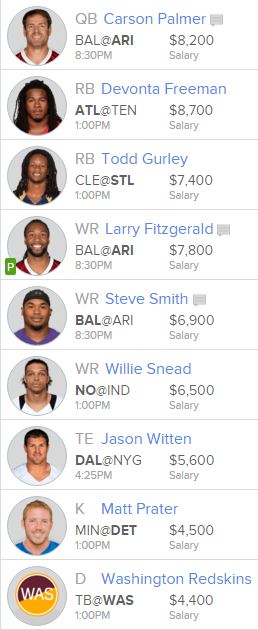
That’s my lineup for Week 7. Don’t forget to compete against me in this week’s TRFC contest!
Printed from TeamRankings.com - © 2005-2024 Team Rankings, LLC. All Rights Reserved.