TeamRankings.com
Get Smart About Sports
October 3, 2015 - by Seth Trachtman
My Week 3 FanDuel lineup scored some winnings in flatter payout structures, but my overall results ended up down overall because I entered it into more tournament-style contests than 50/50s and double ups. I scaled back to only five contests with my lineup this week, but three of those contests were tournaments paying out to the top 25th percentile.
Judging by my results, my lineup finished somewhere around the top 40th percentile of entries.
The Week 3 results:
After three weeks I’ve still made a solid profit on FanDuel:
| Week | # Contests Entered | Total Entry Fees | Total Prize Winnings | Net Gain/Loss for Week | Finals Tickets Won | Cumulative Profit | Cumulative Finals Tickets Won |
|---|---|---|---|---|---|---|---|
| 1 | 5 | $32 | $295 | $295 | 4 | $295 | 4 |
| 2 | 9 | $82 | $0 | ($82) | 0 | $213 | 4 |
| 3 | 5 | $45 | $29 | ($16) | 1 | $197 | 5 |
Given that my lineup is primarily built for the TeamRankings Football Championship, up until now I’ve been hedging my bets a bit.
In short, I’ve been trying to build a team with a relatively “high floor” in scoring to double or triple my money based on the weekly contest format, while also having a fighting chance to land a huge score, finish in the top 3, and win more tickets to the $25,000 Week 11 Final. (I scored one of those in Week 1.)
Going forward, I’m going to more specifically target my lineup to profit in double ups and 50/50s. That will hurt my chances to finish in the top 3 in the TRFC on any given week, but my ultimate goal in FanDuel is to be consistently profitable with a relatively modest number of weekly entries.
There will be at least six teams unavailable for Sunday’s 1 pm ET contests, and possibly eight if the Eagles-Redskins game is postponed due to Hurricane Joaquin. They means fewer choices for FanDuel lineups, and specific contest lineups that are even more similar/popular than usual.
I briefly discussed pick popularity and ownership percentages over the last two weeks, but wanted to dig deeper this week. We’ve gotten our hands on all entry ownership percentages from FanDuel contests last season, which creates some great possibilities for studying the data.
This week I wanted to study the wisdom of the crowd, and look at how ownership percentages correlate with player performance. In other words, how good are FanDuel users at picking the highest scoring players?
The correlation for all of last season between player entry ownership percentage and points earned is 0.438. That medium correlation implies that the FanDuel crowd does have some ability picking the top scorers, but the correlation isn’t particularly strong.
Breaking this correlation down by position does provide some interesting observations.
2014 Fantasy Points Scored vs. Entry Ownership Percentage Correlation
| QB | RB | WR | TE | K | DEF |
|---|---|---|---|---|---|
| 0.390 | 0.544 | 0.492 | 0.436 | 0.181 | 0.278 |
It shouldn’t be a shock to see the weaker correlation for kickers and defenses. These positions have a small range of salaries, and especially with kickers, whose scored tend to be inconsistent from week-to-week.
However, looking at 2014 weeks with byes (Weeks 4-12) shows a higher correlation across the board, with the exception of slightly weaker correlation for running backs.
2014 Fantasy Points Scored vs. Entry Ownership Percentage Correlation (Weeks 4-12)
| QB | RB | WR | TE | K | DEF |
|---|---|---|---|---|---|
| 0.448 | 0.525 | 0.558 | 0.445 | 0.203 | 0.351 |
With fewer players to choose from, the correlation increases.
The takeaway here is that while FanDuel players shouldn’t by default shy away from picking the most popular players (especially in 50/50s and double up contests), going against the crowd and taking unique players with lower ownership percentages — particularly at the positions with weaker correlations — has value.
At the very least, it’s clear that the most popular players are far from a lock to deliver the highest scores.
Next week we’ll build on this ownership percentage analysis by looking at where the top players at each position ranked in ownership percentage each week.
My 3-step strategy didn’t change much going into Week 4, though I think it’s wise to use more 2015 data for matchups after three weeks of games.
To review my strategy:
The highest Vegas-implied point totals include:
| Team | Vegas Implied Points |
|---|---|
| Indianapolis (vs. JAC) | 28.8 |
| Green Bay (@ SF) | 28.2 |
| Atlanta (vs. HOU) | 26.8 |
| Seattle (vs. DET) | 26.5 |
| San Diego (vs. CLE) | 26.0 |
| Buffalo (vs. NYG) | 25.5 |
The lowest Vegas-implied point totals include:
| Team | Vegas Implied Points |
|---|---|
| Detroit (@ DEN) | 16.5 |
| St. Louis (@ ARI) | 17.5 |
| Minnesota (@ DEN) | 18.0 |
| Tampa Bay (vs. CAR) | 18.2 |
| Cleveland (@ SD) | 18.5 |
| Jacksonville (@ IND) | 19.2 |
The Colts have the highest Vegas-implied point total, though it’s important to note that Andrew Luck is questionable to play. If his replacement, Matt Hasselbeck, is called into action, the spread and total will likely fall sharply.
Here’s my lineup for Week 4:
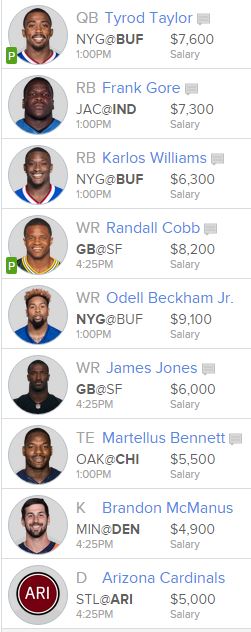
Some notes on the lineup, which includes both objective and subjective analysis:
That’s my lineup for Week 4. Don’t forget to compete against me in this week’s TRFC contest!
Printed from TeamRankings.com - © 2005-2024 Team Rankings, LLC. All Rights Reserved.