TeamRankings.com
Get Smart About Sports
August 25, 2016 - by David Hess
Below are our “official” preseason college football predictions and projected standings for 2016.
We’ve included a few highlights for the more popular conferences, plus some tips on how to interpret the numbers.
(Note: If you’re in a college football pool or betting games, check out our Football Pick’em Pool Picks and College Football Betting Picks. Playable picks went 54.1% against the spread last year.)
During the season, we update these predictions every day on our college football projected standings page.
2016 Predictions & Projected Standings:
ACC | Big Ten | Big 12 | Pac-12 | SEC
All other conferences
Additional Info:
How do we come up with these predictions?
Exactly what do these numbers mean?
Why does our approach make sense?
| ACC | Conference | Overall | Playoffs | ||||
|---|---|---|---|---|---|---|---|
| Atlantic | W | L | W | L | Bowl Eligible | Win Conf | Undef |
| Clemson | 6.6 | 1.4 | 10.3 | 1.7 | 97.7% | 29.2% | 16.0% |
| Florida St | 6.3 | 1.7 | 9.7 | 2.3 | 93.5% | 25.8% | 11.2% |
| Louisville | 5.0 | 3.0 | 8.1 | 3.9 | 83.8% | 7.9% | 2.8% |
| Boston Col | 2.8 | 5.2 | 6.4 | 5.6 | 66.1% | 1.6% | 0.5% |
| Syracuse | 2.7 | 5.3 | 5.0 | 7.0 | 44.8% | 1.2% | 0.2% |
| NC State | 2.7 | 5.3 | 5.5 | 6.5 | 51.0% | 1.0% | 0.2% |
| Wake Forest | 2.7 | 5.3 | 5.9 | 6.1 | 57.7% | 0.7% | 0.3% |
| Coastal | W | L | W | L | Bowl Eligible | Win Conf | Undef |
| N Carolina | 5.1 | 2.9 | 8.3 | 3.7 | 86.0% | 10.5% | 3.4% |
| VA Tech | 4.5 | 3.5 | 6.7 | 5.3 | 67.8% | 5.1% | 1.2% |
| Pittsburgh | 4.0 | 4.0 | 6.7 | 5.3 | 68.2% | 4.6% | 1.0% |
| Miami (FL) | 3.9 | 4.1 | 6.6 | 5.4 | 66.7% | 4.7% | 1.1% |
| GA Tech | 3.8 | 4.2 | 6.4 | 5.6 | 63.0% | 3.9% | 1.0% |
| Duke | 3.3 | 4.7 | 5.7 | 6.3 | 54.6% | 2.4% | 0.5% |
| Virginia | 2.5 | 5.5 | 4.9 | 7.1 | 43.7% | 1.4% | 0.3% |
Champion Pick: Clemson (29.0%), with Florida State (25.9%) close behind, and no others over 10%
Most Improved: Boston College (from 0 to 2.8 conference wins) and Georgia Tech (from 1 to 3.8 conference wins)
Biggest Decline: North Carolina (from 8 to 5.1 conference wins)
Biggest Loser: Virginia (2.5 projected conference wins)
| Big 12 | Conference | Overall | Playoffs | ||||
|---|---|---|---|---|---|---|---|
| Team | W | L | W | L | Bowl Eligible | Win Conf | Undef |
| Oklahoma | 7.6 | 1.4 | 10.2 | 1.8 | 96.3% | 40.8% | 15.9% |
| Baylor | 5.9 | 3.1 | 8.9 | 3.1 | 92.0% | 14.0% | 4.6% |
| TX Christian | 5.6 | 3.4 | 8.2 | 3.8 | 84.3% | 12.5% | 3.5% |
| Oklahoma St | 5.5 | 3.5 | 8.1 | 3.9 | 84.5% | 9.7% | 2.4% |
| W Virginia | 4.8 | 4.2 | 7.0 | 5.0 | 71.4% | 8.3% | 1.7% |
| Texas | 4.4 | 4.6 | 6.2 | 5.8 | 61.9% | 5.5% | 0.7% |
| Texas Tech | 3.9 | 5.1 | 6.2 | 5.8 | 62.8% | 4.1% | 0.7% |
| Kansas St | 3.7 | 5.3 | 5.8 | 6.2 | 57.7% | 2.7% | 0.3% |
| Iowa State | 3.3 | 5.7 | 5.2 | 6.8 | 47.2% | 2.3% | 0.2% |
| Kansas | 0.3 | 8.7 | 1.6 | 10.4 | 1.7% | 0.0% | 0.0% |
Champion Pick: Oklahoma (29.0%), with 3 others over 10% (Baylor, TCU, Oklahoma State)
Most Improved: Iowa State (from 2 to 3.3 conference wins)
Biggest Decline: Oklahoma State (from 7 to 5.5 conference wins) and TCU (from 7 to 5.6 conference wins)
Biggest Loser: Kansas (0.3 projected conference wins)
| Big Ten | Conference | Overall | Playoffs | ||||
|---|---|---|---|---|---|---|---|
| East | W | L | W | L | Bowl Eligible | Win Conf | Undef |
| Ohio State | 7.0 | 2.0 | 9.3 | 2.7 | 92.4% | 24.5% | 7.1% |
| Michigan | 6.9 | 2.1 | 9.8 | 2.2 | 96.5% | 20.8% | 10.1% |
| Michigan St | 6.0 | 3.0 | 7.9 | 4.1 | 79.5% | 12.1% | 3.0% |
| Penn State | 4.3 | 4.7 | 6.2 | 5.8 | 60.2% | 3.2% | 0.9% |
| Indiana | 3.5 | 5.5 | 5.8 | 6.2 | 55.0% | 1.3% | 0.3% |
| Maryland | 3.4 | 5.6 | 5.9 | 6.1 | 58.1% | 1.2% | 0.4% |
| Rutgers | 2.6 | 6.4 | 4.4 | 7.6 | 33.9% | 0.6% | 0.1% |
| West | W | L | W | L | Bowl Eligible | Win Conf | Undef |
| Iowa | 5.9 | 3.1 | 8.7 | 3.3 | 87.5% | 11.9% | 5.9% |
| Nebraska | 5.6 | 3.4 | 8.1 | 3.9 | 84.3% | 8.9% | 2.7% |
| Wisconsin | 4.9 | 4.1 | 7.1 | 4.9 | 74.0% | 7.6% | 1.4% |
| Minnesota | 4.2 | 4.8 | 6.8 | 5.2 | 68.7% | 2.9% | 1.3% |
| Northwestern | 3.9 | 5.1 | 6.2 | 5.8 | 62.0% | 3.5% | 0.7% |
| Illinois | 2.3 | 6.7 | 4.0 | 8.0 | 30.2% | 0.9% | 0.1% |
| Purdue | 2.3 | 6.7 | 4.3 | 7.7 | 35.1% | 0.7% | 0.2% |
Champion Pick: Ohio State (25.1%), with Michigan (20.1%) close behind, and 2 others over 10% (Iowa, Michigan State)
Most Improved: Nebraska (from 3 to 5.6 conference wins)
Biggest Decline: Iowa (from 8 to 5.9 conference wins) and Northwestern (from 6 to 3.9 conference wins)
Biggest Loser: Illinois and Purdue (2.3 projected conference wins each)
Pac-12 Conference Overall Playoffs
North W L W L Bowl Eligible Win Conf Undef
Stanford 6.5 2.5 8.8 3.2 89.3% 20.0% 5.5%
Washington 6.2 2.8 9.1 2.9 92.8% 17.6% 7.6%
Oregon 5.7 3.3 8.0 4.0 82.2% 12.8% 3.6%
Wash State 4.6 4.4 6.9 5.1 70.6% 5.1% 1.3%
California 3.1 5.9 4.9 7.1 42.9% 2.4% 0.4%
Oregon St 2.1 6.9 3.7 8.3 26.2% 0.6% 0.1%
South W L W L Bowl Eligible Win Conf Undef
UCLA 5.9 3.1 7.8 4.2 78.0% 14.3% 3.4%
USC 5.1 3.9 6.6 5.4 65.8% 11.2% 1.1%
Utah 4.7 4.3 7.0 5.0 70.1% 6.8% 2.0%
Arizona 4.3 4.7 6.7 5.3 68.5% 4.9% 1.4%
Arizona St 3.6 5.4 6.2 5.8 61.1% 3.8% 0.8%
Colorado 2.1 6.9 3.8 8.2 24.5% 0.7% 0.0%
Champion Pick: Stanford (20.5%), with Washington (18.1%) close behind, and 3 others over 10% (UCLA, Orgeon, USC)
Most Improved: Washington (from 4 to 6.2 conference wins) and Oregon State (from 0 to 2.1 conference wins)
Biggest Decline: Stanford (from 8 to 6.5 conference wins), Washington State (from 6 to 4.6 conference wins), Oregon (from 7 to 5.7 conference wins), and Utah (from 6 to 4.7 conference wins)
Biggest Loser: Oregon State and Colorado (2.1 projected conference wins each)
| SEC | Conference | Overall | Playoffs | ||||
|---|---|---|---|---|---|---|---|
| East | W | L | W | L | Bowl Eligible | Win Conf | Undef |
| Tennessee | 5.7 | 2.3 | 9.3 | 2.7 | 93.9% | 15.3% | 8.0% |
| Georgia | 5.2 | 2.8 | 8.5 | 3.5 | 86.9% | 9.8% | 5.0% |
| Florida | 4.1 | 3.9 | 7.2 | 4.8 | 79.7% | 3.9% | 1.0% |
| Missouri | 3.2 | 4.8 | 6.3 | 5.7 | 63.9% | 1.8% | 0.6% |
| S Carolina | 3.2 | 4.8 | 6.0 | 6.0 | 58.7% | 1.9% | 0.4% |
| Vanderbilt | 3.1 | 4.9 | 5.6 | 6.4 | 52.7% | 2.0% | 0.6% |
| Kentucky | 1.4 | 6.6 | 4.0 | 8.0 | 25.7% | 0.2% | 0.0% |
| West | W | L | W | L | Bowl Eligible | Win Conf | Undef |
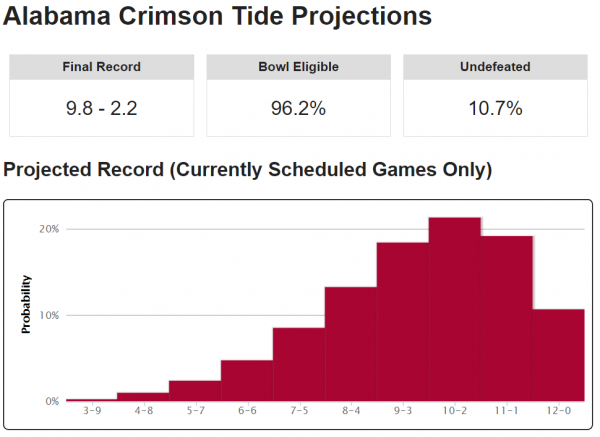
| Alabama | 6.0 | 2.0 | 9.8 | 2.2 | 96.3% | 22.7% | 11.2% |
| LSU | 5.8 | 2.2 | 9.5 | 2.5 | 94.4% | 20.1% | 10.1% |
| Mississippi | 5.0 | 3.0 | 8.1 | 3.9 | 82.7% | 10.6% | 3.4% |
| Miss State | 3.8 | 4.2 | 7.2 | 4.8 | 78.2% | 2.5% | 0.8% |
| Texas A&M | 3.4 | 4.6 | 7.0 | 5.0 | 74.6% | 3.9% | 1.3% |
| Auburn | 3.2 | 4.8 | 6.3 | 5.7 | 64.9% | 2.2% | 0.5% |
| Arkansas | 3.0 | 5.0 | 6.3 | 5.7 | 64.2% | 3.0% | 0.8% |
Champion Pick: Alabama (22.2%), with LSU (19.2%) and Tennessee (17.0%) close behind, and 2 others at about 10% (Georgia, Ole Miss)
Most Improved: Missouri and South Carolina (from 1 to 3.2 conference wins each)
Biggest Decline: Florida (from 7 to 4.1 conference wins)
Biggest Loser: Kentucky (1.4 projected conference wins)
| AAC | Conference | Overall | Playoffs | ||||
|---|---|---|---|---|---|---|---|
| East | W | L | W | L | Bowl Eligible | Win Conf | Undef |
| Temple | 5.3 | 2.7 | 8.5 | 3.5 | 87.3% | 12.7% | 4.4% |
| S Florida | 4.9 | 3.1 | 7.1 | 4.9 | 73.2% | 11.7% | 1.6% |
| Cincinnati | 4.8 | 3.2 | 7.9 | 4.1 | 80.6% | 11.0% | 3.4% |
| E Carolina | 3.9 | 4.1 | 5.8 | 6.2 | 54.7% | 4.6% | 0.5% |
| Connecticut | 3.5 | 4.5 | 5.7 | 6.3 | 53.7% | 4.1% | 0.5% |
| Central FL | 2.3 | 5.7 | 4.2 | 7.8 | 30.4% | 1.0% | 0.0% |
| West | W | L | W | L | Bowl Eligible | Win Conf | Undef |
| Houston | 6.1 | 1.9 | 8.7 | 3.3 | 92.5% | 23.6% | 4.0% |
| Navy | 5.5 | 2.5 | 7.9 | 4.1 | 80.4% | 16.6% | 2.4% |
| Memphis | 4.8 | 3.2 | 7.6 | 4.4 | 79.5% | 10.3% | 1.7% |
| Tulsa | 3.5 | 4.5 | 5.7 | 6.3 | 54.0% | 2.5% | 0.2% |
| S Methodist | 2.3 | 5.7 | 4.2 | 7.8 | 32.2% | 1.6% | 0.1% |
| Tulane | 1.1 | 6.9 | 3.1 | 8.9 | 16.7% | 0.2% | 0.0% |
| CUSA | Conference | Overall | Playoffs | ||||
|---|---|---|---|---|---|---|---|
| East | W | L | W | L | Bowl Eligible | Win Conf | Undef |
| Marshall | 6.5 | 1.5 | 9.0 | 3.0 | 93.1% | 29.0% | 5.0% |
| W Kentucky | 6.3 | 1.7 | 8.9 | 3.1 | 93.0% | 24.4% | 2.3% |
| Middle Tenn | 5.6 | 2.4 | 7.3 | 4.7 | 77.1% | 12.2% | 1.2% |
| Fla Atlantic | 3.6 | 4.4 | 5.2 | 6.8 | 44.6% | 1.9% | 0.1% |
| Old Dominion | 3.3 | 4.7 | 5.1 | 6.9 | 43.0% | 1.0% | 0.1% |
| Florida Intl | 2.8 | 5.2 | 4.2 | 7.8 | 33.2% | 1.2% | 0.1% |
| Charlotte | 1.5 | 6.5 | 2.7 | 9.3 | 11.4% | 0.1% | 0.0% |
| West | W | L | W | L | Bowl Eligible | Win Conf | Undef |
| S Mississippi | 6.0 | 2.0 | 8.1 | 3.9 | 84.4% | 15.7% | 1.1% |
| LA Tech | 4.9 | 3.1 | 6.9 | 5.1 | 72.0% | 8.8% | 0.7% |
| Rice | 3.9 | 4.1 | 5.1 | 6.9 | 42.8% | 2.2% | 0.0% |
| TX El Paso | 3.0 | 5.0 | 5.0 | 7.0 | 43.4% | 1.8% | 0.1% |
| TX-San Ant | 2.7 | 5.3 | 3.7 | 8.3 | 24.3% | 1.0% | 0.0% |
| North Texas | 1.8 | 6.2 | 3.0 | 9.0 | 17.4% | 0.9% | 0.0% |
| MAC | Conference | Overall | Playoffs | ||||
|---|---|---|---|---|---|---|---|
| East | W | L | W | L | Bowl Eligible | Win Conf | Undef |
| Bowling Grn | 5.6 | 2.4 | 7.7 | 4.3 | 82.4% | 19.0% | 1.0% |
| Ohio | 4.0 | 4.0 | 6.5 | 5.5 | 65.9% | 4.3% | 0.3% |
| Kent State | 3.5 | 4.5 | 5.6 | 6.4 | 51.2% | 4.2% | 0.1% |
| Buffalo | 2.7 | 5.3 | 4.3 | 7.7 | 33.0% | 1.8% | 0.1% |
| Akron | 2.6 | 5.4 | 3.8 | 8.2 | 26.7% | 2.0% | 0.1% |
| Miami (OH) | 2.3 | 5.7 | 3.3 | 8.7 | 19.7% | 0.8% | 0.0% |
| West | W | L | W | L | Bowl Eligible | Win Conf | Undef |
| N Illinois | 6.0 | 2.0 | 8.7 | 3.3 | 87.6% | 22.4% | 5.4% |
| Toledo | 5.9 | 2.1 | 8.7 | 3.3 | 89.8% | 19.1% | 4.6% |
| W Michigan | 5.6 | 2.4 | 7.9 | 4.1 | 80.9% | 15.8% | 3.0% |
| Central Mich | 5.0 | 3.0 | 7.2 | 4.8 | 76.2% | 8.0% | 1.0% |
| Ball State | 3.5 | 4.5 | 5.6 | 6.4 | 52.0% | 2.3% | 0.4% |
| E Michigan | 1.2 | 6.8 | 3.0 | 9.0 | 14.9% | 0.3% | 0.0% |
| MWC | Conference | Overall | Playoffs | ||||
|---|---|---|---|---|---|---|---|
| Mountain | W | L | W | L | Bowl Eligible | Win Conf | Undef |
| Boise State | 6.8 | 1.2 | 9.5 | 2.5 | 92.5% | 32.0% | 10.5% |
| Utah State | 5.3 | 2.7 | 7.5 | 4.5 | 77.4% | 11.9% | 1.5% |
| Air Force | 5.2 | 2.8 | 8.2 | 3.8 | 83.9% | 9.5% | 3.6% |
| Colorado St | 3.5 | 4.5 | 5.9 | 6.1 | 56.7% | 2.4% | 0.4% |
| New Mexico | 3.1 | 4.9 | 6.0 | 6.0 | 59.1% | 1.8% | 0.5% |
| Wyoming | 2.2 | 5.8 | 4.0 | 8.0 | 30.9% | 1.2% | 0.1% |
| West | W | L | W | L | Bowl Eligible | Win Conf | Undef |
| San Diego St | 6.5 | 1.5 | 9.5 | 2.5 | 93.9% | 26.9% | 9.0% |
| San Jose St | 4.6 | 3.4 | 6.5 | 5.5 | 65.8% | 7.0% | 0.9% |
| Nevada | 4.1 | 3.9 | 6.3 | 5.7 | 60.6% | 4.8% | 0.4% |
| UNLV | 2.4 | 5.6 | 4.2 | 7.8 | 29.5% | 0.7% | 0.0% |
| Fresno St | 2.4 | 5.6 | 3.7 | 8.3 | 26.0% | 1.2% | 0.1% |
| Hawaii | 2.0 | 6.0 | 3.8 | 9.2 | 23.9% | 0.5% | 0.0% |
| Sun Belt | Conference | Overall | Playoffs | ||||
|---|---|---|---|---|---|---|---|
| Team | W | L | W | L | Bowl Eligible | Win Conf | Undef |
| GA Southern | 7.0 | 1.0 | 9.0 | 3.0 | 93.8% | 40.0% | 3.9% |
| App State | 6.7 | 1.3 | 9.1 | 2.9 | 95.0% | 28.1% | 3.6% |
| Arkansas St | 5.6 | 2.4 | 7.2 | 4.8 | 76.8% | 13.1% | 1.0% |
| Troy | 5.1 | 2.9 | 7.4 | 4.6 | 80.1% | 9.7% | 0.3% |
| LA Lafayette | 4.4 | 3.6 | 6.0 | 6.0 | 58.7% | 3.7% | 0.2% |
| Georgia State | 3.3 | 4.7 | 4.9 | 7.1 | 40.0% | 2.2% | 0.1% |
| Idaho | 3.3 | 4.7 | 4.5 | 7.5 | 33.4% | 1.0% | 0.0% |
| S Alabama | 2.7 | 5.3 | 3.7 | 8.3 | 21.7% | 1.1% | 0.0% |
| LA Monroe | 2.7 | 5.3 | 3.7 | 8.3 | 19.9% | 0.5% | 0.0% |
| Texas State | 1.9 | 6.1 | 2.8 | 9.2 | 13.7% | 0.5% | 0.0% |
| N Mex State | 1.4 | 6.6 | 1.8 | 10.2 | 5.9% | 0.2% | 0.0% |
| Ind. I-A | Conference | Overall | Playoffs | ||||
|---|---|---|---|---|---|---|---|
| Team | W | L | W | L | Bowl Eligible | Win Conf | Undef |
| Notre Dame | -- | -- | 9.6 | 2.4 | 92.6% | -- | -- |
| BYU | -- | -- | 7.4 | 4.6 | 75.8% | -- | -- |
| Army | -- | -- | 6.0 | 6.0 | 60.5% | -- | -- |
| U Mass | -- | -- | 2.2 | 9.8 | 5.9% | -- | -- |
As we noted in our 2016 college football preseason rankings blog post, we have identified a set of team-level metrics that have demonstrated predictive value for projecting a team’s upcoming season results.
We identified these metrics by reviewing about a decade’s worth of college football data and applying significance tests to any interesting looking findings. Then, we built an algorithmic model that takes in these metrics as inputs, and computes a numerical preseason power rating for all 128 FBS teams.
A team’s preseason power rating signifies how good we think it will be this coming season. Figuring out precisely how many games we expect that team to win, however, is a much more complicated problem.
To do that, we run thousands of game-by-game computer simulations of the 2016 college football season, using our predictive ratings to come up with implied win odds for each game.
Thanks to randomness, each season simulation plays out differently. Occasionally an unheralded team like Texas Tech or Arizona gets lucky, makes a run and wins its conference.
Over thousands of simulation runs, though, trends in the results begin to emerge. The 2016 preseason college football predictions in this post represent the averages of all the season simulation runs we conducted.
It’s important to understand how our system generates the results it does, and precisely what they mean.
Here are the key details:
Despite some of the limitations, our data- and simulation-driven approach to making preseason predictions has proven to be a lot more accurate than the alternatives.
Human college football “experts” (some of them, at least) can be decent at projecting the future performance level of a team — especially one they’ve studied closely. But on the whole, they tend to have a very poor grasp of the potential impacts of probability and randomness over the course of a full college football season.
For example, even skilled “football people” tend to underestimate a great team’s odds of losing to a mediocre or bad team. While it’s true that a team like Ohio State is very unlikely to lose to a team like Rutgers, upsets do happen, and those probabilities keep adding up game after game. So you can’t discount them, especially when conference championships can be decided by just one win.
Running thousands of simulations to directly observe the distribution of outcomes generated by all the probabilities at play is a much more objective and precise way to do things.
When the dust settles at the end of the season, our preseason projections will almost certainly be way off for a few teams. As happens every year, some teams simply defy expectations, while other projections will be derailed by injuries, suspensions and other unexpected events that occur as the season goes on.
Our goal is the overall accuracy of the entire system, though — every prediction for every team. By that measure, our methodology has proven very tough to beat.
Printed from TeamRankings.com - © 2005-2024 Team Rankings, LLC. All Rights Reserved.