TeamRankings.com
Get Smart About Sports
November 12, 2015 - by David Hess
————————–
(We even customize them for you pool’s scoring system!)
————————–
Ladies and gentlemen, our projected #1 seeds in the 2016 NCAA tournament:
Wait, what? But North Carolina is #1 in our preseason ratings. How did they end up as a #2 seed, while Duke nabbed a #1 spot?
That was our first reaction upon running these projections, so we dug a bit deeper. We’ll explain what we found in a second, but first, here’s our projected bracket.
(click to enlarge)
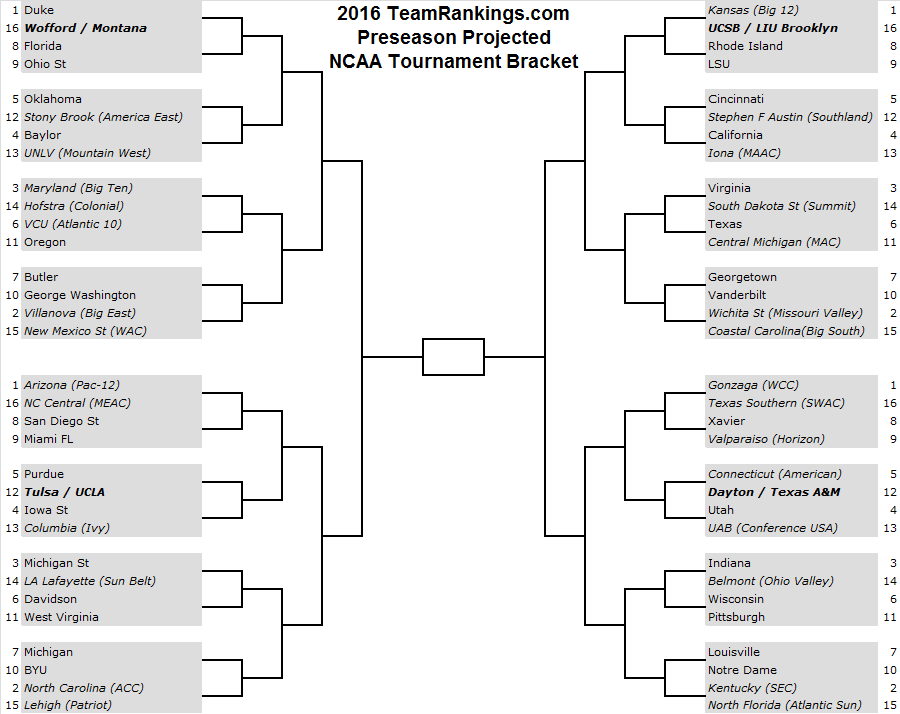
[Note: We’re not worried about following the NCAA’s bracketing rules here. We know that, for example, Oklahoma can’t play Baylor in the first round. Our goal here is to show expected seed lines for each team, and give an idea of the rough quality of opponent they might face in each round. Trying to predict actual bracket matchups at this point is, well, pointless. Though we have to say, that potential Kentucky vs. Louisville Round of 32 matchup sure seems juicy.]
For details on how this bracket was created, see our original Madness Strikes November blog post. That post goes into more detail, but the basic idea is:
For that last step, we use a model that’s been trained on historical selection committee decisions. Put another way, this model uses relevant historical data not to predict how the NCAA Selection Committee should select and seed teams, but rather to predict how it actually will select and seed teams. Sometimes the committee emphasizes things that aren’t necessarily tied to team quality, and that does get taken into account by our model.
Which brings us to the Duke-getting-a-1-seed-over-North-Carolina issue …
There seem to be two main factors at work here:
OK, so what is it about Duke’s schedule that leads to our model projecting them with higher #1 seed odds? We think it’s partly an issue of game location.
Historically, selection committees have rewarded big wins on neutral courts nearly as strongly as big road wins. If you look at Duke’s toughest future games, and North Carolina’s toughest future games, you’ll see that Duke’s toughest non-conference matchup is on a neutral court against Kentucky, whereas North Carolina’s is on the road against Texas.
Conveniently for our purposes, both teams have 57% projected win odds in those games. However, a neutral court win against Kentucky is likely going to end up looking better on Duke’s resume than a road win at Texas will on North Carolina’s.
That pattern holds across the schedule; Duke’s toughest games include more home and neutral site games than UNC’s. For games where the teams have equivalent win odds, Duke is actually facing on average a slightly better team — Duke’s degree of difficulty is coming more from opponent strength than from game location.
What this essentially means is that Duke is getting more resumé bang for their win odds buck, as the selection committee tends to reward beating good teams regardless of game location.
Of course, at this point in the season, there’s a very large margin of error on these projections. No team is currently projected with more than a 29% chance at a #1 seed, or a 95% chance to make the NCAA tournament.
Since those odds are the true output of our model (the bracket is created algorithmically based on the odds), here are our official 2016 NCAA Tournament preseason projected bracketology odds for every team, sorted by their probability of making the 2016 NCAA tournament. Bookmark this page for later, so you can come back and congratulate us on getting every single team correct. 😉
For a sortable table of similar odds that we update daily, check out our NCAA Bracket Projections detail page.
| TR Bracket Seed | Team | Bid | Auto | At Large | Avg Seed If In | 1-4 Seed | 1 Seed |
|---|---|---|---|---|---|---|---|
| 2 | Wichita St | 95% | 60% | 34% | 4.5 | 55% | 20% |
| 1 | Kansas | 94% | 35% | 59% | 3.7 | 66% | 28% |
| 1 | Gonzaga | 94% | 61% | 34% | 4.1 | 61% | 27% |
| 2 | N Carolina | 94% | 26% | 68% | 3.9 | 63% | 25% |
| 1 | Duke | 93% | 24% | 69% | 3.6 | 66% | 29% |
| 2 | Kentucky | 93% | 37% | 56% | 4.2 | 58% | 20% |
| 1 | Arizona | 89% | 34% | 55% | 3.8 | 61% | 26% |
| 3 | Virginia | 88% | 19% | 69% | 5 | 45% | 12% |
| 2 | Villanova | 86% | 33% | 53% | 4.8 | 49% | 15% |
| 3 | Maryland | 84% | 18% | 66% | 4.8 | 48% | 15% |
| 3 | Michigan St | 76% | 17% | 58% | 5.5 | 36% | 10% |
| 9 | Valparaiso | 75% | 57% | 18% | 9 | 11% | 1% |
| 3 | Indiana | 74% | 17% | 57% | 5.3 | 36% | 11% |
| 5 | Oklahoma | 72% | 15% | 57% | 6.3 | 26% | 5% |
| 5 | Connecticut | 72% | 31% | 41% | 6.4 | 27% | 5% |
| 5 | Cincinnati | 72% | 29% | 43% | 6.6 | 26% | 4% |
| 4 | Iowa State | 70% | 14% | 56% | 5.7 | 33% | 9% |
| 4 | Utah | 68% | 18% | 50% | 5.8 | 29% | 7% |
| 12 | Ste F Austin | 68% | 59% | 9% | 10.9 | 2% | 0% |
| 4 | California | 67% | 16% | 51% | 6 | 28% | 7% |
| 4 | Baylor | 66% | 10% | 56% | 6 | 28% | 8% |
| 5 | Purdue | 65% | 9% | 56% | 6.1 | 27% | 6% |
| 6 | Davidson | 65% | 17% | 47% | 6.8 | 20% | 3% |
| 8 | San Diego St | 63% | 25% | 38% | 7.2 | 18% | 2% |
| 6 | VCU | 62% | 18% | 45% | 6.7 | 21% | 4% |
| 6 | Texas | 62% | 11% | 51% | 6.8 | 20% | 4% |
| 7 | Butler | 62% | 18% | 43% | 6.4 | 22% | 4% |
| 12 | Stony Brook | 62% | 50% | 12% | 10.3 | 3% | 0% |
| 6 | Wisconsin | 61% | 9% | 52% | 6.4 | 22% | 5% |
| 7 | Georgetown | 61% | 16% | 46% | 6.7 | 22% | 4% |
| 8 | Florida | 58% | 11% | 46% | 7.2 | 16% | 3% |
| 7 | Louisville | 57% | 6% | 52% | 6.3 | 23% | 6% |
| 7 | Michigan | 57% | 9% | 48% | 6.4 | 21% | 5% |
| 8 | Xavier | 57% | 14% | 42% | 6.7 | 19% | 3% |
| 10 | BYU | 57% | 19% | 38% | 7.8 | 12% | 1% |
| 13 | Iona | 57% | 42% | 15% | 10.5 | 3% | 0% |
| 8 | Rhode Island | 56% | 14% | 42% | 6.6 | 19% | 3% |
| 9 | Miami (FL) | 56% | 5% | 51% | 7.1 | 15% | 2% |
| 9 | Ohio State | 55% | 8% | 47% | 6.5 | 20% | 5% |
| 10 | Vanderbilt | 54% | 10% | 44% | 6.9 | 16% | 3% |
| 15 | N Mex State | 54% | 53% | 2% | 13.7 | 0% | 0% |
| 9 | LSU | 52% | 12% | 40% | 6.5 | 18% | 3% |
| 10 | Notre Dame | 52% | 5% | 47% | 6.8 | 16% | 3% |
| 13 | UNLV | 52% | 31% | 21% | 8.8 | 9% | 1% |
| 11 | Oregon | 51% | 9% | 42% | 7 | 16% | 3% |
| 11 | Central Mich | 51% | 24% | 27% | 7.9 | 11% | 1% |
| 10 | Geo Wshgtn | 50% | 16% | 35% | 7.1 | 14% | 2% |
| 12 | Tulsa | 50% | 17% | 33% | 7.8 | 11% | 1% |
| 13 | UAB | 50% | 37% | 13% | 10 | 5% | 0% |
| 14 | Belmont | 50% | 41% | 9% | 11.8 | 1% | 0% |
| 11 | W Virginia | 48% | 7% | 41% | 7.2 | 14% | 3% |
| 14 | LA Lafayette | 48% | 37% | 11% | 11.1 | 2% | 0% |
| 14 | S Dakota St | 48% | 41% | 8% | 12 | 1% | 0% |
| 11 | Pittsburgh | 47% | 4% | 43% | 6.8 | 15% | 3% |
| 12 | Dayton | 47% | 11% | 36% | 7.1 | 14% | 2% |
| 12 | Texas A&M | 46% | 8% | 38% | 6.8 | 15% | 3% |
| 12 | UCLA | 46% | 8% | 38% | 7.3 | 13% | 2% |
| 15 | Coastal Car | 46% | 42% | 4% | 12.9 | 0% | 0% |
| Illinois | 45% | 5% | 39% | 6.9 | 15% | 3% | |
| 13 | Columbia | 43% | 36% | 7% | 9 | 6% | 1% |
| 15 | N Florida | 43% | 42% | 1% | 13.7 | 0% | 0% |
| Boise State | 43% | 15% | 28% | 7.9 | 9% | 1% | |
| Old Dominion | 41% | 20% | 20% | 9.3 | 4% | 0% | |
| Syracuse | 40% | 3% | 36% | 7.3 | 11% | 2% | |
| Richmond | 40% | 10% | 30% | 7.9 | 8% | 1% | |
| 14 | Hofstra | 38% | 27% | 11% | 10.5 | 2% | 0% |
| Iowa | 38% | 4% | 33% | 7.7 | 8% | 1% | |
| NC State | 38% | 2% | 35% | 7.8 | 8% | 1% | |
| Illinois St | 38% | 11% | 27% | 8.9 | 5% | 0% | |
| Georgia St | 38% | 29% | 9% | 11.5 | 1% | 0% | |
| Memphis | 35% | 13% | 22% | 7.8 | 7% | 2% | |
| Oklahoma St | 35% | 5% | 30% | 7.8 | 7% | 1% | |
| Vermont | 35% | 29% | 5% | 11.8 | 0% | 0% | |
| 16 | NC Central | 34% | 34% | 0% | 14.7 | 0% | 0% |
| N Iowa | 34% | 10% | 24% | 9.9 | 2% | 0% | |
| 16 | TX Southern | 33% | 33% | 0% | 15.7 | 0% | 0% |
| Akron | 33% | 18% | 15% | 9.7 | 3% | 0% | |
| S Carolina | 32% | 6% | 27% | 7 | 9% | 2% | |
| Georgia | 32% | 4% | 28% | 7.6 | 8% | 1% | |
| Oregon St | 31% | 4% | 27% | 8.5 | 5% | 0% | |
| Pepperdine | 31% | 9% | 22% | 9.4 | 2% | 0% | |
| 15 | Lehigh | 30% | 25% | 5% | 12.4 | 0% | 0% |
| Clemson | 30% | 2% | 28% | 8 | 6% | 1% | |
| Florida St | 30% | 2% | 28% | 8.2 | 5% | 1% | |
| Evansville | 30% | 10% | 20% | 8.8 | 4% | 0% | |
| LA Tech | 30% | 15% | 15% | 9.9 | 2% | 0% | |
| Wm & Mary | 30% | 19% | 12% | 11 | 1% | 0% | |
| 16 | UCSB | 29% | 20% | 9% | 11.7 | 1% | 0% |
| New Mexico | 29% | 10% | 19% | 8.6 | 5% | 0% | |
| 16 | Wofford | 28% | 25% | 3% | 13.9 | 0% | 0% |
| Yale | 28% | 22% | 6% | 10.7 | 1% | 0% | |
| Murray St | 28% | 23% | 5% | 12.1 | 0% | 0% | |
| NJIT | 28% | 27% | 1% | 14.1 | 0% | 0% | |
| GA Tech | 27% | 2% | 25% | 7.9 | 6% | 1% | |
| UC Irvine | 27% | 18% | 8% | 11.4 | 1% | 0% | |
| 16 | Montana | 26% | 24% | 2% | 14.2 | 0% | 0% |
| Princeton | 26% | 22% | 4% | 10.7 | 1% | 0% | |
| Providence | 25% | 5% | 21% | 8.2 | 5% | 1% | |
| Boston U | 25% | 22% | 3% | 12.9 | 0% | 0% | |
| Cal Poly | 24% | 18% | 6% | 11.6 | 1% | 0% | |
| Northeastrn | 24% | 16% | 8% | 12.1 | 0% | 0% | |
| High Point | 24% | 23% | 1% | 13.9 | 0% | 0% | |
| Temple | 23% | 7% | 16% | 9.9 | 2% | 0% | |
| Kent State | 23% | 12% | 11% | 10.2 | 1% | 0% | |
| Middle Tenn | 23% | 10% | 13% | 10.3 | 1% | 0% | |
| Buffalo | 23% | 12% | 11% | 10.5 | 1% | 0% | |
| Hawaii | 23% | 19% | 4% | 11.5 | 0% | 0% | |
| N Dakota St | 23% | 21% | 2% | 13.8 | 0% | 0% | |
| Chattanooga | 23% | 21% | 2% | 14 | 0% | 0% | |
| Bucknell | 22% | 19% | 2% | 12.9 | 0% | 0% | |
| Weber State | 22% | 20% | 2% | 14.2 | 0% | 0% | |
| Creighton | 21% | 5% | 16% | 8.5 | 3% | 0% | |
| Mississippi | 21% | 3% | 18% | 9.2 | 2% | 0% | |
| Arkansas | 19% | 2% | 17% | 8.3 | 3% | 0% | |
| Utah State | 19% | 6% | 13% | 9.6 | 1% | 0% | |
| 16 | LIU-Brooklyn | 18% | 18% | 0% | 15 | 0% | 0% |
| USC | 18% | 3% | 15% | 8 | 3% | 0% | |
| Colorado | 18% | 3% | 14% | 8.3 | 3% | 0% | |
| Seton Hall | 18% | 4% | 14% | 8.7 | 3% | 0% | |
| St Josephs | 18% | 4% | 15% | 8.8 | 3% | 0% | |
| Stanford | 18% | 2% | 16% | 9.1 | 2% | 0% | |
| E Washingtn | 18% | 18% | 1% | 14.5 | 0% | 0% | |
| Mt St Marys | 18% | 17% | 0% | 15.1 | 0% | 0% | |
| Norfolk St | 18% | 18% | 0% | 15.2 | 0% | 0% | |
| Tennessee | 17% | 2% | 15% | 9.1 | 2% | 0% | |
| Arizona St | 17% | 2% | 14% | 9.1 | 2% | 0% | |
| Lg Beach St | 17% | 12% | 5% | 12.7 | 0% | 0% | |
| Southern | 17% | 17% | 0% | 15.8 | 0% | 0% | |
| Jackson St | 17% | 17% | 0% | 15.8 | 0% | 0% | |
| James Mad | 16% | 12% | 4% | 11.6 | 1% | 0% | |
| Mercer | 16% | 16% | 1% | 14.2 | 0% | 0% | |
| Rob Morris | 16% | 16% | 0% | 15.3 | 0% | 0% | |
| Colorado St | 15% | 6% | 9% | 9.3 | 1% | 0% | |
| Alabama | 15% | 2% | 13% | 9.4 | 1% | 0% | |
| WI-Grn Bay | 15% | 12% | 3% | 12.9 | 0% | 0% | |
| Rider | 15% | 12% | 2% | 13.7 | 0% | 0% | |
| CS Bakersfld | 15% | 15% | 0% | 15.4 | 0% | 0% | |
| Marquette | 14% | 4% | 10% | 8.3 | 2% | 0% | |
| Minnesota | 14% | 1% | 12% | 8.4 | 2% | 0% | |
| Miss State | 14% | 2% | 12% | 8.5 | 2% | 0% | |
| La Salle | 14% | 2% | 12% | 9.5 | 1% | 0% | |
| NW State | 14% | 13% | 1% | 14.1 | 0% | 0% | |
| St Fran (NY) | 14% | 14% | 0% | 15.2 | 0% | 0% | |
| Hampton | 14% | 14% | 0% | 15.3 | 0% | 0% | |
| St Bonavent | 13% | 3% | 11% | 9.2 | 1% | 0% | |
| U Mass | 13% | 3% | 10% | 9.4 | 1% | 0% | |
| Albany | 13% | 12% | 1% | 13.5 | 0% | 0% | |
| St Marys | 12% | 4% | 8% | 9.5 | 1% | 0% | |
| Wake Forest | 12% | 0% | 11% | 10.1 | 1% | 0% | |
| Toledo | 12% | 7% | 5% | 11.1 | 0% | 0% | |
| Harvard | 12% | 10% | 3% | 11.3 | 0% | 0% | |
| SC Upstate | 12% | 11% | 0% | 14.7 | 0% | 0% | |
| Fla Gulf Cst | 12% | 11% | 0% | 14.7 | 0% | 0% | |
| UMKC | 12% | 12% | 0% | 15.6 | 0% | 0% | |
| Fresno St | 11% | 4% | 7% | 10 | 1% | 0% | |
| Manhattan | 11% | 9% | 2% | 13.7 | 0% | 0% | |
| Army | 11% | 11% | 1% | 14 | 0% | 0% | |
| Sam Hous St | 11% | 10% | 1% | 14.2 | 0% | 0% | |
| Monmouth | 11% | 9% | 1% | 14.2 | 0% | 0% | |
| Alabama St | 11% | 11% | 0% | 15.9 | 0% | 0% | |
| Alab A&M | 11% | 11% | 0% | 15.9 | 0% | 0% | |
| Northwestern | 10% | 1% | 9% | 8.5 | 1% | 0% | |
| Indiana St | 10% | 3% | 7% | 10.7 | 0% | 0% | |
| E Michigan | 10% | 5% | 5% | 11.2 | 0% | 0% | |
| W Michigan | 10% | 6% | 5% | 11.5 | 0% | 0% | |
| Detroit | 10% | 8% | 2% | 12.5 | 0% | 0% | |
| Oral Roberts | 10% | 9% | 1% | 14.4 | 0% | 0% | |
| Bryant | 10% | 10% | 0% | 15.2 | 0% | 0% | |
| Loyola-Chi | 9% | 3% | 5% | 10 | 1% | 0% | |
| TX El Paso | 9% | 6% | 3% | 10.9 | 0% | 0% | |
| LA Monroe | 9% | 7% | 1% | 13.7 | 0% | 0% | |
| Canisius | 9% | 8% | 1% | 13.7 | 0% | 0% | |
| American | 9% | 8% | 1% | 13.9 | 0% | 0% | |
| Denver | 9% | 8% | 0% | 14.4 | 0% | 0% | |
| Sacred Hrt | 9% | 9% | 0% | 15.3 | 0% | 0% | |
| Auburn | 8% | 1% | 8% | 9.9 | 1% | 0% | |
| Miami (OH) | 8% | 5% | 3% | 11.4 | 0% | 0% | |
| Wright State | 8% | 6% | 2% | 12.5 | 0% | 0% | |
| Oakland | 8% | 7% | 1% | 13.5 | 0% | 0% | |
| Delaware | 8% | 6% | 1% | 13.7 | 0% | 0% | |
| Morehead St | 8% | 7% | 1% | 13.9 | 0% | 0% | |
| E Kentucky | 8% | 8% | 1% | 14.2 | 0% | 0% | |
| TX A&M-CC | 8% | 8% | 0% | 14.7 | 0% | 0% | |
| W Carolina | 8% | 8% | 0% | 14.7 | 0% | 0% | |
| NC-Grnsboro | 8% | 8% | 0% | 15 | 0% | 0% | |
| Winthrop | 8% | 7% | 0% | 15.1 | 0% | 0% | |
| N Arizona | 8% | 8% | 0% | 15.1 | 0% | 0% | |
| Howard | 8% | 8% | 0% | 15.5 | 0% | 0% | |
| Seattle | 8% | 8% | 0% | 15.6 | 0% | 0% | |
| Ball State | 7% | 5% | 2% | 11.4 | 0% | 0% | |
| NC-Wilmgton | 7% | 6% | 2% | 12.7 | 0% | 0% | |
| Drexel | 7% | 6% | 2% | 12.9 | 0% | 0% | |
| N Hampshire | 7% | 7% | 1% | 13.9 | 0% | 0% | |
| Fairfield | 7% | 6% | 1% | 13.9 | 0% | 0% | |
| Furman | 7% | 6% | 0% | 14.9 | 0% | 0% | |
| E Tenn St | 7% | 6% | 0% | 15 | 0% | 0% | |
| VA Military | 7% | 6% | 0% | 15.1 | 0% | 0% | |
| Wagner | 7% | 7% | 0% | 15.3 | 0% | 0% | |
| Idaho | 7% | 7% | 0% | 15.3 | 0% | 0% | |
| Siena | 7% | 7% | 0% | 15.3 | 0% | 0% | |
| St Fran (PA) | 7% | 7% | 0% | 15.4 | 0% | 0% | |
| Utah Val St | 7% | 7% | 0% | 15.7 | 0% | 0% | |
| W Kentucky | 6% | 3% | 3% | 11.3 | 0% | 0% | |
| Bowling Grn | 6% | 4% | 2% | 12.1 | 0% | 0% | |
| Cleveland St | 6% | 5% | 1% | 12.8 | 0% | 0% | |
| UC Riverside | 6% | 5% | 1% | 14.1 | 0% | 0% | |
| Loyola-MD | 6% | 6% | 1% | 14.1 | 0% | 0% | |
| TN Martin | 6% | 5% | 0% | 14.8 | 0% | 0% | |
| IPFW | 6% | 6% | 0% | 14.9 | 0% | 0% | |
| Gard-Webb | 6% | 6% | 0% | 15.1 | 0% | 0% | |
| NC-Asheville | 6% | 6% | 0% | 15.2 | 0% | 0% | |
| Sac State | 6% | 6% | 0% | 15.4 | 0% | 0% | |
| Portland St | 6% | 6% | 0% | 15.4 | 0% | 0% | |
| Maryland ES | 6% | 6% | 0% | 15.7 | 0% | 0% | |
| NC A&T | 6% | 6% | 0% | 15.8 | 0% | 0% | |
| Prairie View | 6% | 6% | 0% | 15.9 | 0% | 0% | |
| Wash State | 5% | 1% | 5% | 9.8 | 0% | 0% | |
| Texas Tech | 5% | 0% | 4% | 10.2 | 0% | 0% | |
| San Diego | 5% | 2% | 3% | 11.1 | 0% | 0% | |
| Pacific | 5% | 1% | 3% | 11.2 | 0% | 0% | |
| WI-Milwkee | 5% | 4% | 1% | 13.4 | 0% | 0% | |
| UC Davis | 5% | 4% | 1% | 13.4 | 0% | 0% | |
| Texas State | 5% | 4% | 1% | 13.9 | 0% | 0% | |
| Towson | 5% | 4% | 1% | 14 | 0% | 0% | |
| TX-Arlington | 5% | 5% | 0% | 14.1 | 0% | 0% | |
| AR Lit Rock | 5% | 5% | 0% | 14.1 | 0% | 0% | |
| Lipscomb | 5% | 5% | 0% | 14.9 | 0% | 0% | |
| Radford | 5% | 5% | 0% | 15.3 | 0% | 0% | |
| Ark Pine Bl | 5% | 5% | 0% | 16 | 0% | 0% | |
| Duquesne | 4% | 1% | 3% | 9.8 | 0% | 0% | |
| Saint Louis | 4% | 1% | 3% | 9.8 | 0% | 0% | |
| Penn State | 4% | 0% | 4% | 9.9 | 0% | 0% | |
| Geo Mason | 4% | 1% | 3% | 10.4 | 0% | 0% | |
| DePaul | 4% | 1% | 3% | 10.7 | 0% | 0% | |
| Wyoming | 4% | 2% | 2% | 10.8 | 0% | 0% | |
| Dartmouth | 4% | 4% | 0% | 12.4 | 0% | 0% | |
| U Penn | 4% | 4% | 0% | 12.6 | 0% | 0% | |
| S Alabama | 4% | 4% | 1% | 13.9 | 0% | 0% | |
| Arkansas St | 4% | 4% | 0% | 14.4 | 0% | 0% | |
| SE Missouri | 4% | 4% | 0% | 14.7 | 0% | 0% | |
| TN State | 4% | 4% | 0% | 14.7 | 0% | 0% | |
| W Illinois | 4% | 4% | 0% | 15.1 | 0% | 0% | |
| Neb Omaha | 4% | 4% | 0% | 15.2 | 0% | 0% | |
| Charl South | 4% | 4% | 0% | 15.3 | 0% | 0% | |
| IUPUI | 4% | 4% | 0% | 15.3 | 0% | 0% | |
| N Colorado | 4% | 3% | 0% | 15.4 | 0% | 0% | |
| S Utah | 4% | 4% | 0% | 15.4 | 0% | 0% | |
| Morgan St | 4% | 4% | 0% | 15.8 | 0% | 0% | |
| Washington | 3% | 0% | 3% | 9.4 | 0% | 0% | |
| Nebraska | 3% | 0% | 3% | 9.5 | 0% | 0% | |
| VA Tech | 3% | 0% | 3% | 9.6 | 0% | 0% | |
| Kansas St | 3% | 0% | 3% | 9.7 | 0% | 0% | |
| Houston | 3% | 1% | 2% | 10.4 | 0% | 0% | |
| Portland | 3% | 1% | 2% | 10.9 | 0% | 0% | |
| Nevada | 3% | 1% | 2% | 11 | 0% | 0% | |
| San Fransco | 3% | 2% | 2% | 11.3 | 0% | 0% | |
| Ohio | 3% | 2% | 1% | 11.7 | 0% | 0% | |
| Marshall | 3% | 2% | 2% | 12.2 | 0% | 0% | |
| N Illinois | 3% | 2% | 1% | 12.3 | 0% | 0% | |
| Rice | 3% | 2% | 1% | 12.7 | 0% | 0% | |
| TN Tech | 3% | 3% | 0% | 14.1 | 0% | 0% | |
| Col Charlestn | 3% | 2% | 0% | 14.3 | 0% | 0% | |
| Elon | 3% | 2% | 0% | 14.3 | 0% | 0% | |
| App State | 3% | 3% | 0% | 14.4 | 0% | 0% | |
| Lafayette | 3% | 3% | 0% | 14.5 | 0% | 0% | |
| Holy Cross | 3% | 3% | 0% | 14.6 | 0% | 0% | |
| Quinnipiac | 3% | 3% | 0% | 14.8 | 0% | 0% | |
| CS Fullerton | 3% | 2% | 0% | 14.8 | 0% | 0% | |
| St Peters | 3% | 3% | 0% | 14.8 | 0% | 0% | |
| Lamar | 3% | 3% | 0% | 14.9 | 0% | 0% | |
| South Dakota | 3% | 3% | 0% | 15.1 | 0% | 0% | |
| Campbell | 3% | 3% | 0% | 15.4 | 0% | 0% | |
| Jacksonville | 3% | 3% | 0% | 15.4 | 0% | 0% | |
| Savannah St | 3% | 3% | 0% | 15.7 | 0% | 0% | |
| Samford | 3% | 3% | 0% | 15.7 | 0% | 0% | |
| TX-Pan Am | 3% | 3% | 0% | 15.8 | 0% | 0% | |
| Chicago St | 3% | 3% | 0% | 15.8 | 0% | 0% | |
| Beth-Cook | 3% | 3% | 0% | 15.9 | 0% | 0% | |
| TX Christian | 2% | 0% | 2% | 9.8 | 0% | 0% | |
| Missouri | 2% | 0% | 2% | 10.4 | 0% | 0% | |
| E Carolina | 2% | 1% | 1% | 11 | 0% | 0% | |
| S Illinois | 2% | 1% | 1% | 11.2 | 0% | 0% | |
| Missouri St | 2% | 1% | 2% | 11.3 | 0% | 0% | |
| Santa Clara | 2% | 1% | 1% | 11.9 | 0% | 0% | |
| Charlotte | 2% | 2% | 1% | 13 | 0% | 0% | |
| Brown | 2% | 2% | 0% | 13.1 | 0% | 0% | |
| Fla Atlantic | 2% | 1% | 1% | 13.4 | 0% | 0% | |
| Austin Peay | 2% | 1% | 0% | 14.4 | 0% | 0% | |
| E Illinois | 2% | 2% | 0% | 14.7 | 0% | 0% | |
| GA Southern | 2% | 2% | 0% | 14.8 | 0% | 0% | |
| Navy | 2% | 2% | 0% | 14.9 | 0% | 0% | |
| Colgate | 2% | 2% | 0% | 15.2 | 0% | 0% | |
| SE Louisiana | 2% | 2% | 0% | 15.4 | 0% | 0% | |
| North Dakota | 2% | 2% | 0% | 15.6 | 0% | 0% | |
| Longwood | 2% | 2% | 0% | 15.7 | 0% | 0% | |
| F Dickinson | 2% | 2% | 0% | 15.7 | 0% | 0% | |
| Montana St | 2% | 2% | 0% | 15.8 | 0% | 0% | |
| Delaware St | 2% | 2% | 0% | 15.9 | 0% | 0% | |
| S Car State | 2% | 2% | 0% | 15.9 | 0% | 0% | |
| Fordham | 1% | 0% | 0% | 9.7 | 0% | 0% | |
| St Johns | 1% | 0% | 1% | 10.5 | 0% | 0% | |
| Tulane | 1% | 0% | 1% | 11.5 | 0% | 0% | |
| Central FL | 1% | 1% | 1% | 11.6 | 0% | 0% | |
| Air Force | 1% | 1% | 1% | 11.9 | 0% | 0% | |
| Drake | 1% | 1% | 0% | 12 | 0% | 0% | |
| S Florida | 1% | 1% | 1% | 12 | 0% | 0% | |
| Cornell | 1% | 1% | 0% | 13.5 | 0% | 0% | |
| TX-San Ant | 1% | 1% | 0% | 13.6 | 0% | 0% | |
| Florida Intl | 1% | 1% | 0% | 13.6 | 0% | 0% | |
| Youngs St | 1% | 1% | 0% | 14.2 | 0% | 0% | |
| IL-Chicago | 1% | 1% | 0% | 14.8 | 0% | 0% | |
| Binghamton | 1% | 1% | 0% | 14.8 | 0% | 0% | |
| Hartford | 1% | 1% | 0% | 14.8 | 0% | 0% | |
| Troy | 1% | 1% | 0% | 14.8 | 0% | 0% | |
| Cal St Nrdge | 1% | 1% | 0% | 15.1 | 0% | 0% | |
| SIU Edward | 1% | 1% | 0% | 15.2 | 0% | 0% | |
| Houston Bap | 1% | 1% | 0% | 15.3 | 0% | 0% | |
| Marist | 1% | 1% | 0% | 15.3 | 0% | 0% | |
| Niagara | 1% | 1% | 0% | 15.3 | 0% | 0% | |
| McNeese St | 1% | 1% | 0% | 15.5 | 0% | 0% | |
| Presbyterian | 1% | 1% | 0% | 15.6 | 0% | 0% | |
| New Orleans | 1% | 1% | 0% | 15.6 | 0% | 0% | |
| Central Conn | 1% | 1% | 0% | 15.6 | 0% | 0% | |
| Liberty | 1% | 1% | 0% | 15.8 | 0% | 0% | |
| Idaho State | 1% | 1% | 0% | 15.8 | 0% | 0% | |
| Boston Col | 0% | 0% | 0% | 9.1 | 0% | 0% | |
| Rutgers | 0% | 0% | 0% | 9.9 | 0% | 0% | |
| Bradley | 0% | 0% | 0% | 12.2 | 0% | 0% | |
| Loyola Mymt | 0% | 0% | 0% | 12.9 | 0% | 0% | |
| North Texas | 0% | 0% | 0% | 14.6 | 0% | 0% | |
| Maine | 0% | 0% | 0% | 15.2 | 0% | 0% | |
| Jksnville St | 0% | 0% | 0% | 15.4 | 0% | 0% | |
| Maryland BC | 0% | 0% | 0% | 15.4 | 0% | 0% | |
| Nicholls St | 0% | 0% | 0% | 15.6 | 0% | 0% | |
| Kennesaw St | 0% | 0% | 0% | 15.7 | 0% | 0% | |
| Coppin State | 0% | 0% | 0% | 16 | 0% | 0% | |
| Citadel | 0% | 0% | 0% | 16 | 0% | 0% | |
| Miss Val St | 0% | 0% | 0% | 16 | 0% | 0% | |
| Grambling St | 0% | 0% | 0% | 16 | 0% | 0% | |
| Massachusetts Lowell | 0% | 0% | 0% | 0 | 0% | 0% | |
| Incarnate Word | 0% | 0% | 0% | 0 | 0% | 0% | |
| N Kentucky | 0% | 0% | 0% | 0 | 0% | 0% | |
| Grand Canyon | 0% | 0% | 0% | 0 | 0% | 0% | |
| Central Ark | 0% | 0% | 0% | 0 | 0% | 0% | |
| Abilene Christian | 0% | 0% | 0% | 0 | 0% | 0% | |
| S Methodist | 0% | 0% | 0% | 0 | 0% | 0% | |
| San Jose St | 0% | 0% | 0% | 0 | 0% | 0% | |
| Florida A&M | 0% | 0% | 0% | 0 | 0% | 0% | |
| Stetson | 0% | 0% | 0% | 0 | 0% | 0% | |
| Alcorn State | 0% | 0% | 0% | 0 | 0% | 0% | |
| S Mississippi | 0% | 0% | 0% | 0 | 0% | 0% |
Finally, here’s a quick reminder. If you haven’t checked out the rest of our projections, please do! They include:
Printed from TeamRankings.com - © 2005-2024 Team Rankings, LLC. All Rights Reserved.