In Defense Of TV Cliches: Continuity And Three-Point Shooting | Stat Geek Idol
March 15, 2012 - by Holt Sherman
***IMPORTANT NOTE*** This is an entry in our inaugural Stat Geek Idol contest. The opinions and predictions expressed below do not represent the views of TeamRankings.com, and are solely those of the author. This article was conceived of and written by Holt Sherman.
When it comes to choosing a strategy for selecting NCAA Tournament ‘bracket busters’ (defined here as seeds 9-16 who at minimum advance to the sweet 16), we should remember two factors the “talking heads” often mention as being the reasons for upsets:
1. Continuity from the previous season
2. 3-Point shooting
By quantifying these factors, especially continuity, we can see if they support the television clichés, and maybe give some clues for 2012.
Measuring Continuity From The Previous Season
Continuity from the previous season, as defined here, is the percent of current season production by players who were also on the team the previous year. This can be measured by a “Continuity Ratio”. To calculate this, we first measure production by using a simple PER (Player Efficiency Rating) of:
(Points + Total Rebounds + Assists + Blocks + Steals) – ((FG Attempted – FG Made) + (FT Attempted – FT Made) + Turnovers)
As an example, let’s look at Kentucky freshman Anthony Davis. Davis’s PER is a whopping 26.2 (average NCAA player is 6). Davis’s PER is calculated from:
(14.4 points + 9.9 total rebounds + 0.8 assists + 4.7 blocks + 1.4 steals) – ((8.3 fg attempted – 5.5 fg made) + (4.6 ft attempted – 3.3 ft made) + 0.9 turnovers)
The next step to find the Continuity Ratio is to take the current season PER for only players who were on the team in the previous season, and divide that by the current season PER for all players.
Again, looking at Kentucky as our example, their total current PER is 98.2, of which only 40.0 PER came from players there the previous year, meaning they have a Continuity Ratio of 40.7%. This 40.7% number is significantly lower than the 2012 NCAA average of 66.4%, which is what we’d expect given the high-level performance of Kentucky’s freshman class (and in particular, Anthony Davis.)
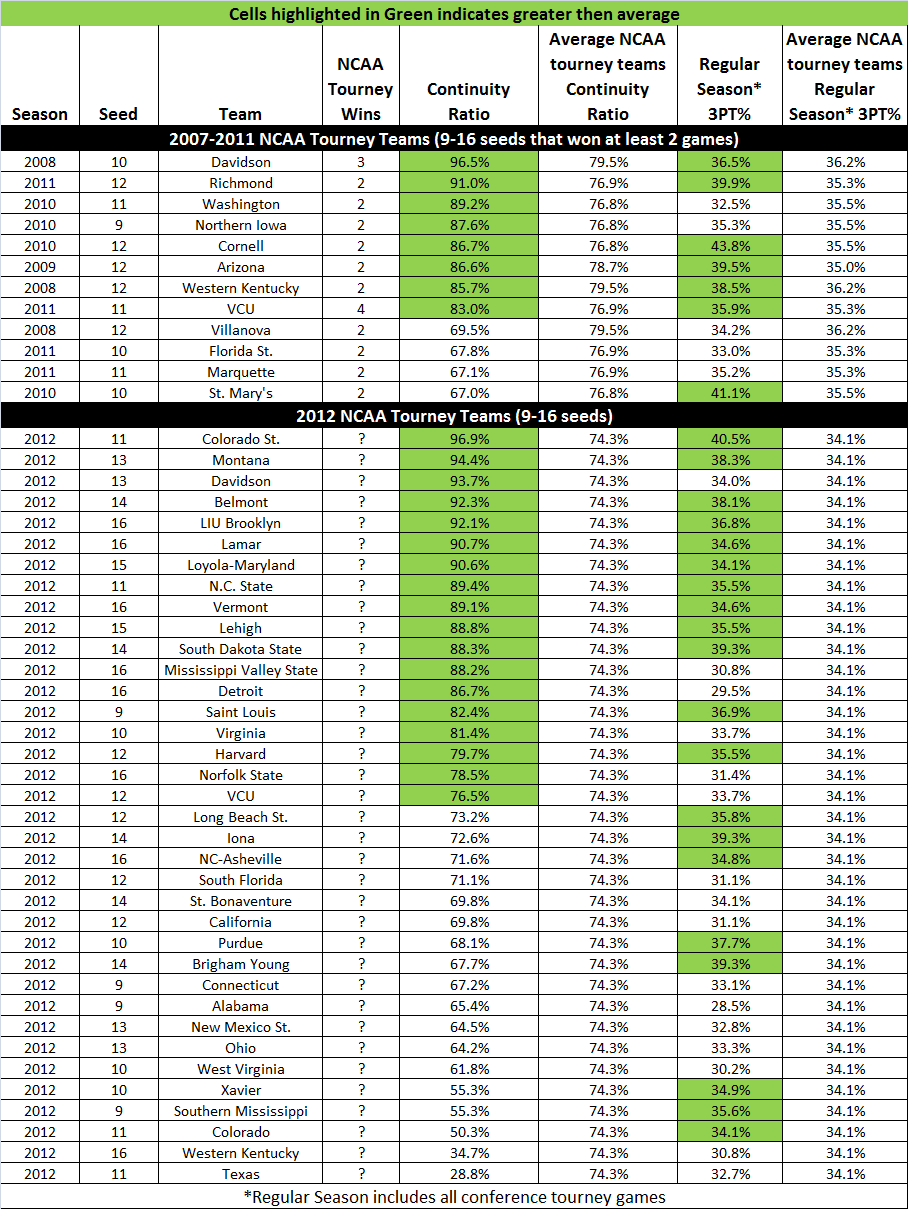
In looking at the table of bracket-busting teams at the end of this post, you’ll notice that 8 of the 12 Bracket-Busting teams from 2007-2011 have a Continuity Ratio greater than the NCAA average of 78% for all NCAA tourney teams, and in some cases, far above the average.
‘The Greatest Equalizer In College Basketball’
So said Coach Billy Donovan on the 3-point line after the Gators made ten 3’s to beat Alabama in the 2012 SEC tourney.
As shown in the table, of the 12 bracket-busting teams from 2007-2011, nine of them shot over 35% on 3-pointers during the regular season, with seven of them above the NCAA tourney average of approximately 35.5%.
Bottom Line
The bottom line is if a 9-16 seed is going to make a run, history shows us they will likely be teams with a lot of players back from the previous season, along with having a track record in the regular season of using the 3-point shot with an efficiency that is close to or above 35%.
In the table below, in addition to performance by bracket-busting teams from 2007-2011, also shown are 2012 NCAA teams that are seeded 9-16. These 2012 teams are highlighted in green if they have a better than average performance in one of these two categories and may be better positioned to make a run in the tourney.
(click to enlarge)
Printed from TeamRankings.com - © 2005-2024 Team Rankings, LLC. All Rights Reserved.
