When Is A Win More Than A Win? Using Round Of 64 Games To Predict NCAA Tournament Success | Stat Geek Idol
March 22, 2012 - by Michael Lopez
This is a Sweet 16 submission in our inaugural Stat Geek Idol contest. It was conceived of and written by Michael Lopez.
After a 71-70 nail biting win over 15th-seeded Belmont in 2008, Duke star Gerald Henderson wasn’t worried, telling reporters “a win’s a win.” Two days later, alas, the Blue Devils were making tee times, as 7th-seeded West Virginia upset the 2nd-seeded Blue Devils, 73-67.
Eight years before Henderson made his comments, Florida coach Billy Donovan was probably telling his team the same thing, after his 5th-seeded Gators needed a Mike Miller jumper to avoid an upset at the hands of 12th-seeded Butler. Unlike Duke, however, Donovan and the Gators quickly regrouped, and two weeks later they were playing Michigan State in the national title game.
Does one of these examples – in Duke’s case, a close win predicting future gloom, and for Florida, the buzzer beater propelling the Gators to future success – represent a larger trend? This piece takes a closer look.
The Ashley Judds Are Underdogs Vs. The Ghost Of Chris Bosh
Depending on the point of view, the Duke and Florida examples can be used as evidence for or against the importance of first-round performance when it comes to tournament success.
Commentators and coaches tend to be split, with the former entrenched in the idea of momentum and the latter staunchly defending each win as the only relevant outcome. The 2012 tournament, thus far, is no different. TBS commentator Charles Barkley, for example, was asked who could keep up with Kentucky, winners of two consecutive routs, and responded, slyly, “the Toronto Raptors.”
Syracuse coach Jim Boeheim, meanwhile, was forced to defend his squad after a squeaker over 16th-seeded UNC-Asheville, insisting the better team won on the scoreboard despite the close call. Added Boeheim, “the scoreboard doesn’t lie.” While Boeheim may indeed believe winning is the only relevant outcome from the game, perhaps he also understood that hiding his disappointment might prevent doubt from creeping into his players’ minds. But was Boeheim onto something?
Champs Win Early Games By A Higher Margin Than Runners-Up
Our sample consists of the 896 NCAA tournament games between 1998 and 2011. For clarification, this study considers Thursday and Friday games as 1st-Round contests, despite the NCAA tournament committee telling us that such an honor is reserved for Lamar vs. Vermont.
The last 14 Division 1 men’s basketball champions won their first-round games by an average of roughly 26 points. This might seem impressive, but by comparison’s sake, top-seeded teams averaged nearly a 28 point victory over that span. Interestingly enough, national runner-ups averaged a first-round victory margin of just 16 points, an estimate pulled down by a few games, including the aforementioned Florida contest and, more recently and ironically, Butler (2010, 2 point first-round win).
Of course, if this shot had landed a few inches higher, the difference between champion and runner-up margin of first-round victory would probably not be significant. Still, using a 2-sample t-test, the difference between first-round margin of victory comparing eventual champions and runner-ups is significant, with a p-value of 0.01.
Can Top Seeds Generate ‘Momentum’ With An Easy Win?
Of course, momentum from a first-round blowout is more likely to carryover into a second round game, as opposed to a game on championship weekend.
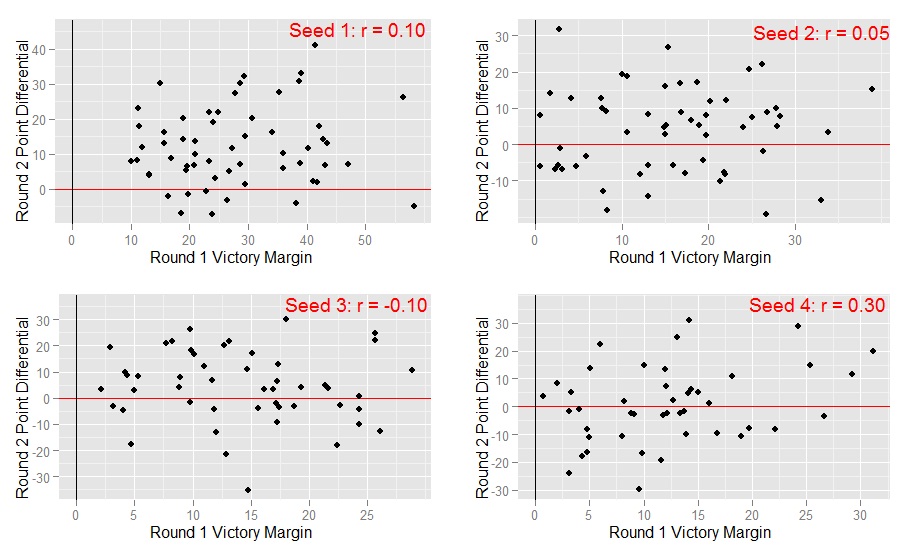
To examine the relationship between first-round margin of victory and second-round performance, several scatter plots are shown. Since teams seeded 2, 3, and 4 face more difficult second-round match-ups than top seeds, the comparison of first-round victory margin and second-round point differential are separated by seed.
Further, r, the correlation coefficient, is presented. A commonly used metric comparing the association between two continuous variables, r measures the strength of linearity between first-round victory margin and second-round point differential. A positive r suggests that teams with larger first-round wins tend to produce higher second-round point differentials, and lends credence to the idea of game-to-game momentum in March Madness. An r near 0 indicates no linear relationship and an r less than 0 suggests that as first-round victory margin increases, second-round point differential decreases.
The table below has scatter plots for the top 4 seeds.
The results from the table above are mixed, but the evenly distributed scatter suggests round two performances are roughly independent from round one outcomes. For example, the eight No. 1 seeds in our sample with the closest first-round wins – victories by 15 points or less – all avoided a second-round upset.
This year, add Syracuse to the mix. After its six point win over UNC-Asheville, the closest first-round game for a top-seed in the last 15 years, the Orange trounced both Kansas St. and Frank Martin’s cowboy boots by 16 points. Meanwhile, the top-seed with the largest first-round victory in the last 14 years, Kansas in 1998, actually lost its next game, losing to URI after smoking Prairie View A&M by 58.
Meanwhile, 3rd-seeded teams actually seem to perform worse in the second round when their first-round victory margin increased, as suggested by a negative (-0.10) correlation. This year, Georgetown followed this bizarre potential trend, as the 3rd-seeded Hoyas smacked Belmont by 16 points before falling to NC-State, 66-63.
The only top-seed where victory margin appeared to matter is among 4th-seeds, where first-round margin and second round point differential share a correlation of 0.30. Of the 11 teams seeded No. 4 who won their first-round game by five points or less, seven lost in round two, with those losses of course coming against teams either seeded No. 5 or No. 12. However, the sample size here is too small, and the graph too scattered, to suggest this association is not simply due to chance.
Not A Top Seed? Al Davis Knew What To Do – Just Win, Baby!
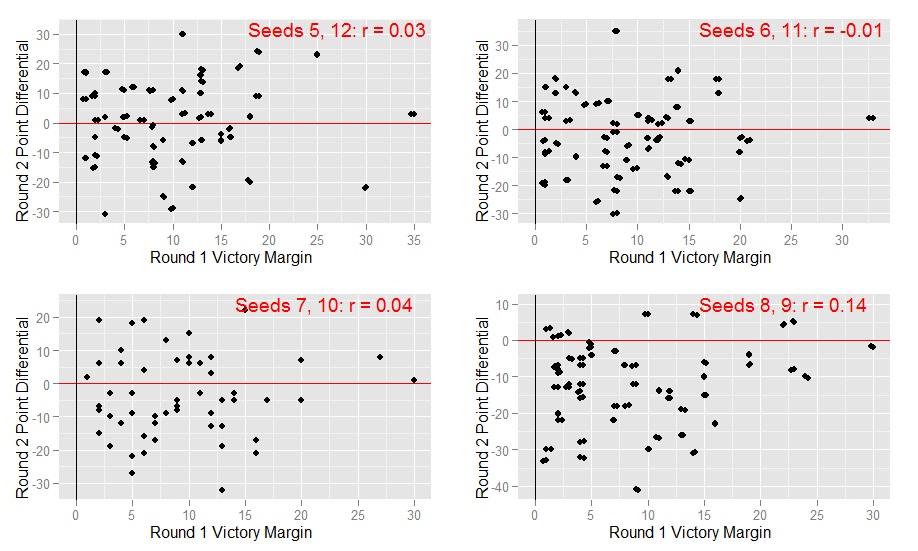
For seeds five through twelve, similar plots are produced. Sadly, bottom seeds (seeds 13+) are left out since they don’t win often enough. So, um, apologies to Ohio. One can’t imagine this study will get too many page views, anyways, but this certainly did.
Since teams seeded No. 12, No. 11, No. 10, and No. 9 win often enough, they are combined them with seeds No. 5, No. 6, No. 7, and No. 8, respectively. This combination increases our sample size and reduces the number of plots. Since each pair (No. 5 and No. 12, etc) likely faces the same higher seed (for No. 5 and No. 12, the 4th-seed) upon a victory, this seems valid. Alternative analysis of each seed separately, incidentally, yielded similar results.
So What Does All This Tell Us?
Once again, first-round performance appears to have little or no impact on second-round outcomes.
In all four pairs of teams above, a stronger first-round performance was not associated with an improved second round effort. For every 2004 Illinois (won by 19 over 12th-seed Murray St., won by 24 over 4th-seed Cincinnati), there’s a 2003 Florida (won by 30 over 12th-seed Sam Houston St, lost by 22 to 4th-seed Michigan St.). It seems unlikely that momentum gained from an excellent first-round game does carry over to the second-round.
Thus, the next time a commentator – say one that sounds like Rill Bafftery – tries to convince an audience that a team is on a roll, recognize that while the scoreboard doesn’t lie, in March Madness, it might not tell you as much as you think.
Printed from TeamRankings.com - © 2005-2024 Team Rankings, LLC. All Rights Reserved.

