Vegas Opening Line Data Insights: February Tightens Up
February 16, 2012 - by John Ezekowitz
Back in October, over at the HSAC blog, I tried to examine how the Vegas betting market for college basketball games improves over the course of the season.
To do this, I looked at the spread of the results from the Vegas expectation (the game line) over the course of the season. Interestingly, I found that the deviation from the line did not get much smaller as the season progressed, implying that the Vegas market was similarly efficient throughout the season.
Unfortunately, I only had the closing line when I did that analysis; the opening line is much more pertinent.
Opening Lines vs. Closing Lines
The opening line (usually) reflects Vegas’s best estimate of the strength of the teams while the closing line reflects the entire market’s assessment. If opening lines are more variable, as measured by the size of the miss from the line, then bettors should theoretically be able to find more value in betting.
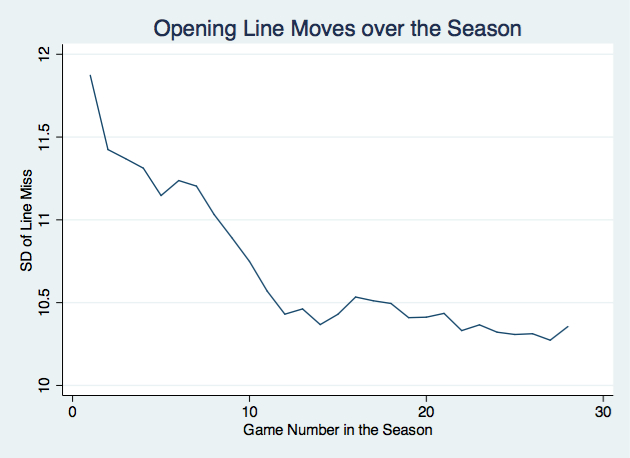
Now I have a dataset of five years of opening lines for college basketball. As before, I grouped games by the order in which they happened in a team’s season (i.e. first games of teams with other first games, second games with other second games, etc), and dropped games when I did not have at least 20 lines in the season for the team. The results, summarized in the graph below which uses a four-game moving average, are fairly convincing:
The first game of the season is by far the most variant. The lines become sharper as Vegas acquires more information about teams, then level off as conference play starts (around game 14). This makes sense: conference play represents a break in the season where teams often start to play against dramatically different competition. As you can see, the sharpest lines are right around now, at the end of conference play. I didn’t include later games past the 29th, as I didn’t have a large enough sample size.
Line Moves Get Smaller As The Season Progresses
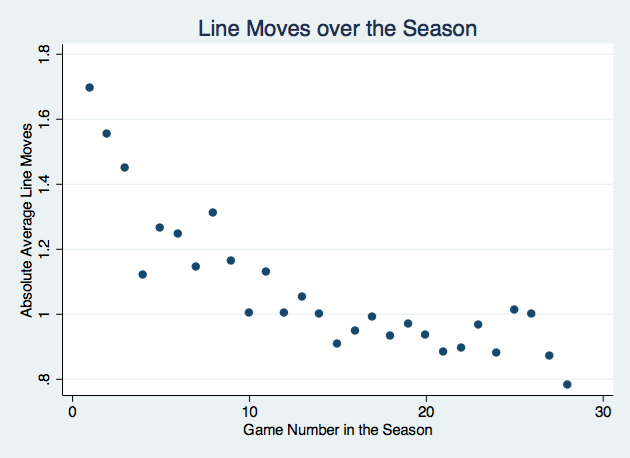
The news gets worse for bettors attempting to be +EV in February:
The above graph shows the average absolute line move for each of the games throughout the season. As you can see, the difference between the opening line and the closing line gets consistently smaller the season goes on. This implies that Vegas is making fewer “bad lines” as it gets more information in the form of results about teams. The standard deviation of the line misses probably can’t get much smaller than 9.5 points because basketball is an inherently random game, but the decreasing line moves could indicate that the oddsmakers continue to get better as the season goes along.
While there is clearly inherent variation, bettors looking to make money betting college basketball will find this stretch of the season, on average, to be the toughest.
Printed from TeamRankings.com - © 2005-2024 Team Rankings, LLC. All Rights Reserved.

