Coaches Love Blocks: How Statistics Determine Player Minutes | Stat Geek Idol
March 23, 2012 - by Nathan Walker
This is a Sweet 16 submission in our inaugural Stat Geek Idol contest. It was conceived of and written by Nathan Walker of the basketball distribution.
In almost every study I have done in trying to explain and predict NBA player performance, one glaring omission recurs: fouls appear insignificant. That is, over time, a player’s fouling does not appear to affect their per-possession impact on their team in a meaningful way that doesn’t already show up in box scores.
The best explanation for this is that fouls are very easily predicted by other statistics (Rebounds/Field-Goal-Attempts/Etc), which impact performance at an even greater degree. So its effects can’t really shine through in computer analysis. Sure, we can agree that players with more playing time impact the game more, and are likely better overall than their counterparts that don’t play often, but play well. But I would argue that players do control their minutes: by their fouling habits.
Armed with this hypothesis, we can look at a few different ways that player-minutes are affected.
Player Minutes Are Determined By Quality, Fouls & Teammates
Usually, when I do player analysis, I am limited to a scope of about 300 players at a time in the NBA. But with TeamRankings.com’s database of over 20,000 NCAA player-seasons and their minutes since 2007, we now have a huge sample size to play with (I only look at players who played in at least 90% of games, so around 15,000). So I will attempt to answer a few questions questions:
-Which statistics do coaches love? (What per-40-minute-statistics translate to more playing time)
-Who is the most vital to their team?
We will work under the impression that a player’s minutes are the result of the following:
Things we can directly attempt to measure
A) Per-minute ability, as perceived by coach (better player = more playing time)
B) Foul Trouble (more fouls = less playing time)
C) Teammates’ perceived ability & Foul Trouble (better teammates = relaxed playing time)
Things we cannot directly measure
D) Fatigue (tired guys gotta sit out!)
E) Anything else (including error)
For part I, we won’t be measuring “true” ability (or any semblance of it). We can attempt to measure this, but not for the purposes of this post.
Coaches Love Blocks
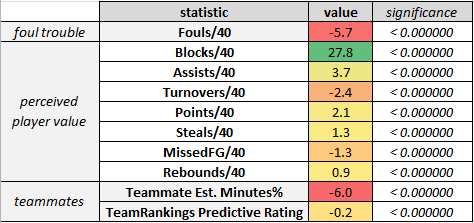
So, using some software in Excel, we can see a very simple correlation that explains player minutes to some degree of accuracy (R^2 of 0.5, for those keeping score). To put all players on the same page, I used their Healthy-Minutes% (the % of a game played, excluding games where they were suspended/injured/etc).
This picture shows how individual per-minute statistics explain playing time in Minutes% (out of 100)*.
*Intercept not shown
A few things stick out from this picture, including hypothetical reasons why.
1) The relative value of a Block is incredibly high to player’s perceived value
a. Blocks are hard to come by, from a coaching standpoint
2) Assists are worth more than points to a coach
a. Point guards are more involved in offensive decisions for a whole team
b. Coaches understand that assists create points
As expected, quality teammates and foul trouble lead to lower minutes played.
The Most Valuable Players This Season, According To Coaches
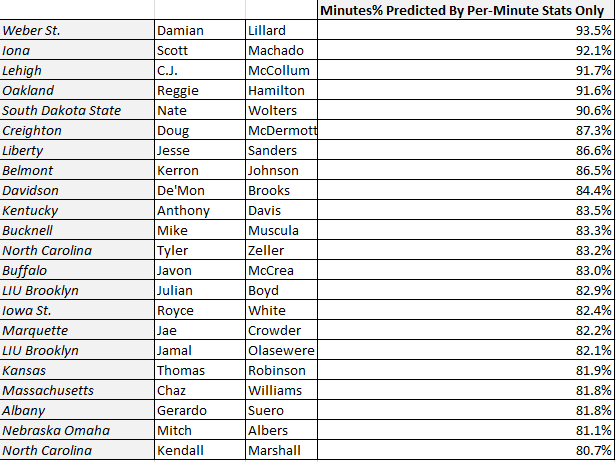
One important factor here is that a player’s overall contributions might be overstated if their team has a poor strength of schedule – easy opponents might make a player look more valuable. But if we only look at the ‘perceived player value’ statistics, the following players are tops for 2012 (as of Selection Sunday):
North Carolina players are a bit biased here, as they play the fastest of any of the top teams (and these are not adjusted for pace), but their value is still noteworthy.
In Part II, we will examine the efficacy of this ‘optimal’ solution implemented by coaches.
Printed from TeamRankings.com - © 2005-2024 Team Rankings, LLC. All Rights Reserved.

