TeamRankings.com
Get Smart About Sports
March 30, 2012 - by Nathan Walker
This is a Final Four submission in our inaugural Stat Geek Idol contest. It was conceived of and written by Nathan Walker of the basketball distribution (@bbstats). For more from Nathan check out his posts from previous rounds.
Sweet 16 entry: Coaches Love Blocks: How Statistics Determine Player Minutes
Round of 64 entry: Not All Points Are Created Equally
Last week, the North Carolina Tar Heels suffered a crushing loss to the Kansas Jayhawks in the Sweet 16. Following the loss of ultimate-pass-machine Kendall Marshall to a wrist injury in their second NCAA tourney game, the Heels looked shaky against Ohio. It took a strong overtime performance by UNC to finish off the Bobcats. Any casual observer could tell you that the Tar Heels struggled to adjust to backup point guard Stillman White; after all, Marshall had barely touched the bench all season, at 33 minutes per game.
After the Ohio game, forward John Henson was quoted saying,
“We didn’t have our starting point guard, so it was a little tough out there.”
And the Tar Heels had to adjust much more, since their 2nd-string point guard Dexter Strickland suffered a torn ACL late January. But intuition and statistics agree that there is a reason adjusting to a point guard loss is tough for any team: your #1 passer plays the large majority of all possible minutes.
Let’s back up for a second.
As we have learned, on the surface it appears that coaches love blocks. In my previous post, I discussed how different parts of a player’s game affected his playing time. A player’s production of blocks per minute, for example, is roughly twenty-seven times more predictive of playing time than rebounds. But with a little more in-depth analysis, we can see which statistical categories truly lead to higher minutes; hopefully we will determine which player rotation benefits teams the most. So let’s review what we did last time, and improve our math a little, making insights along the way!
Heavy-handed stat geekery in this phrase we will be using. Let’s refresh real quick:
“Production”: By this we mean a player’s game statistics, plain and simple.
“Per”: A player’s total production (for example, total points) is going to increase if they get more minutes, so we need to adjust for this by dividing by their playing time. This is especially necessary here, where we are measuring minutes. Using per-game statistics would be ‘cheating’ in estimating minutes, as players with more playing time are obviously going to rack up more stats.
“Possession”: Our standard stat geek way of adjusting things is to view each statistic in a “per possession” context. Some teams play faster than others, but each team is bound by the same number of possessions in a game. The only real exception to this in our analysis is # of fouls, which players on faster-paced teams seem to struggle with a little more. Faster paced teams have more opportunities to foul, lowering a player’s minutes (harder for a coach to put you in if you have four fouls rather than three).
So “Points Per 100” simply refers to the amount of points a player scores on average over the course of 100 possessions they play in.
Before I tell you what the numbers say, let’s review which numbers I’m using:
1) 2007-2012 NCAA Division I players
2) Players must have participated in at least 75% of their team’s games in the given season.
3) Players must have played at least 25% of said games (roughly 10 minutes).
I also removed players from teams that had limited or missing data. After all this, exactly 16,179 player-seasons made the cut. Congrats!
Each player statistic has diminishing returns – one reason being that we know that a player cannot play more than 40 minutes in a regulation game, so it follows that in extreme cases of per-possession production (i.e. 11 turnovers per 100 possessions of play), we need to level off our estimated minutes. It’s like buying flowers for your girlfriend (no discrimination here!): one flower and she’ll hug you. Ten and she’ll kiss you! But once you’ve given her a million flowers, each successive flower had better not be worth another hug, or she’d tire to death. We’ll see more of this when we talk about turnovers in the results section.
Furthermore, if a coach is perfectly rational (hi, economists!), they will understand that production of rebounds, for example, do not benefit your team as much as they become more and more frequent. But that’s a subject we could spend years on, so we’ll have to leave it at that for now.
A player who most frequently passes the ball and racks up assists is much more likely to be in the game than a similar role player who does not get the assist: different aspects of the game are controlled by different players. As I was pulling this system together, I lamented that in my 6-seasons-worth-of-data, I did not have each player’s position. To compensate and return more insight, we will examine each player’s rank on their team. For example, is there a significant difference between the #1 and #2 most frequent passer, but not much difference between #2 and #3, #3 and #4, and so on and so forth.
The answer becomes quite obvious with Assists (and Kendall Marshall’s prominence), in the following graphic:

The player who most frequently passes the ball seems to be well-identified by coaches in the NCAA. In our large 5-year sampling of players, the #1 player in Assist Production plays 28.8 minutes on average, compared to 24.9 minutes and slightly lower for the rest. When it comes to predicting a player’s minutes, we should expect rank to impact negatively against positive factors such as points: the lower the rank, the better the player.
So we know that we can estimate player minutes with some accuracy using regression. We also know that it is harder to get playing time on really good teams (or seemingly good teams), so we can compensate for this by measuring expected teammate Minutes; as we learned in the prior blog post, teammates who fit our statistical profile will by the very nature of the game decrease a player’s minutes played. So:
1) I took each team and projected player minutes as we have been describing (adjusting for amount of player-minutes that did not make the minutes cutoff);
2) I then used each player’s estimated teammate minutes as part of the regression equation (Teammate Minutes = Team Minutes – Player Minutes).
3) The computer gave me a final regression equation.
For each of these 16,000+ players, using my statistical model, we can estimate player minutes with an error of +/- 4.5 (that’s the RMSE value – for you pocket-protector collectors – and each variable had a p-value significance of less than 0.003).
Rather than showing exactly how the model predicts minutes, I’m going to show how it impacts standard deviations. As was mentioned in the last post, blocks are probably more “valuable” because they are harder to come by; 10 blocks are much rarer than 10 points in a basketball game. But how does an average shot blocker compare with an average scorer?
To answer this, we look at standard deviations (or more accurately – standardized coefficients). Perhaps the actual math course called statistics wasn’t your favorite (mine was pretty miserable actually), so I’ll simplify: how much does deviating from a statistical average impact your minutes, when we adjust for how hard such a change is (roughly: blocking 50% more is the same as scoring 50% more). Everything here is on the same scale: one standard deviation on the chart leads to an increase in one standard deviation in minutes.
CUE THE BIG SCARY GRAPH (scroll down if you fear a migraine):
(click to enlarge)

The strangest part of this graph is the fact that Turnovers are shown as positive, sort of. Just to prove that this isn’t only an effect of all the other variables, check out this slightly less menacing graphic:

In red is Turnovers in addition to all the other statistics (similar to the scary graph): slight curve upwards then as a player has a higher and higher turnover rate, the less minutes they receive. The blue is even more dramatic, but that is because it is trying to explain all the variation in Minutes. The principle here might remain the same as much of our other conclusions: point guards (who happen to pass the ball a lot and generate turnovers as a side effect of their job) get a lot of minutes. In fact, any player who handles the ball a lot in general will be turning the ball over with higher frequency per-possession. But any player who finds themselves in extremely high turnover situations are going to lose that privilege. At around 7.5 turnovers per 100, the figure drops back down.
For some perspective, 7.5 turnovers per 100 is about 4.9 per 40 minutes; a player who players 20 minutes on average would hit this rate at about 2.48 per game.
For those who avoided BIG SCARY GRAPH, here’s the easier version – similar to the analysis on my last blog post. If we only want to look at the individual stat lines themselves, what do we find in terms of player minutes?
CUE THE CUTE LITTLE BABY GRAPH:
(click to enlarge)

This version predicts within 5.3 (RMSE), which honestly is not a whole lot worse. This one most easily explains the high incidence of Blocks from last round: while individual blocks are extremely important, the overall ability to block shots is not more decisive to a player’s rotation than things like Scoring and Fouling.
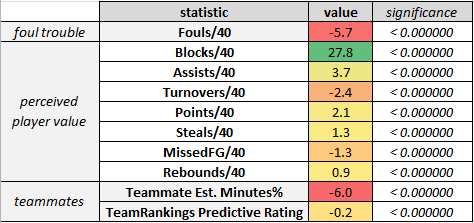
It depends on how you look at it, to be sure. For one estimate, I summed each team’s per-minute player statistics (of qualifying players) and looked at how well it predicted efficiency margin (point margin divided by possessions). By using the same “standard deviations” (standardized coefficients) method above, I found the following to be true (I looked at the standardized coefficients versus efficiency margin for teams, rather than player minutes%, and subtracted):
-Players getting in foul trouble decreases efficiency margin heavily (+0.4 standard deviation difference from expected)
-Coaches play players that turn the ball over too frequently (likely caused by poor teams relying on turnover-prone point guards, difference of -0.4)
-Coaches undervalue steals (players with high rates of stealing are, in fact, a steal! +0.2 standard deviation difference).
All in all we can see that NCAA players have a wealth of information to be gleaned from their minutes played – hopefully this research can continue and act as a tool to help coaches who need any incremental gains they can get, especially in the field of 345 (or 344, depending on who you ask) D-I teams.
Remember, for more from Nathan check out his posts from previous rounds.
Sweet 16 entry: Coaches Love Blocks: How Statistics Determine Player Minutes
Round of 64 entry: Not All Points Are Created Equally
And for more from the other contestants, explore the Stat Geek Idol category on the blog!
Printed from TeamRankings.com - © 2005-2024 Team Rankings, LLC. All Rights Reserved.