The NBA Lockout Has Increased Injury Rates
February 7, 2012 - by David Hess
This article was written by Doug VanDerwerken using data provided by TeamRankings. Doug is a PhD student in Statistics at Duke University and a lifelong basketball fan.
If you have an idea for a guest post here on the TR blog, please don’t hesitate to email us.
In a recent post, Kevin Meers demonstrated that there has been no significant increase in the number of injuries in the NFL despite the 2011 lockout. When I read his article, I wondered if the same held true for the current NBA season.
Because of the 2011 NBA lockout, the regular season did not get underway until Christmas Day, 2011—almost two months after the normal starting date. And while the number of games has been reduced from 82 to 66, this still amounts to about an extra game every two weeks as compared with typical seasons. Plenty of sportswriters and commentators have suggested that this compacted schedule would lead to more injuries. My question was whether the actual data showed any evidence of this.
Injuries Per Day Have Increased
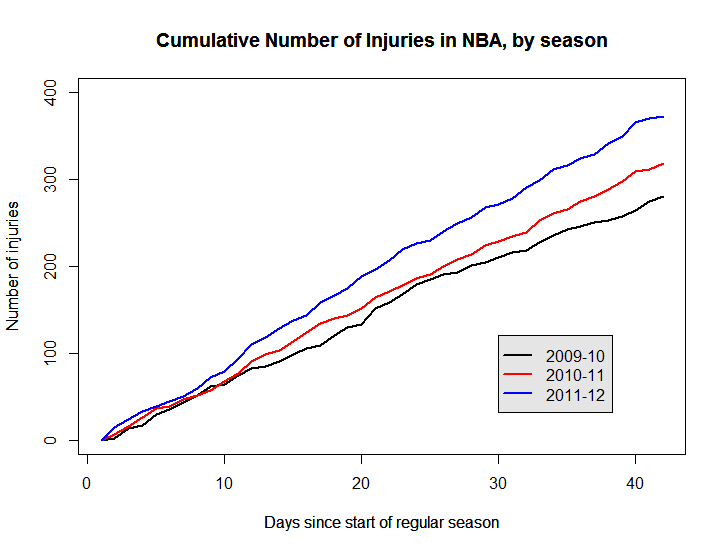
The data covered all injuries in the NBA from summer 2009 up until 9 AM on February 4, 2012. That’s two full seasons and the first 41 days of the 2011-12 season. Here’s a graph of the cumulative injuries that took place in each season by day 41.
It is obvious that there are more injuries in the 2011-12 season than in either of the others, but is this difference significant? In other words, is the difference large enough that we can reasonably attribute it to the lockout as opposed to mere randomness? After all, the graph also shows that the 2010-11 season had more injuries than the previous season, but there was no lockout that year. How do we know that the increase in 2011 isn’t just another random jump? We use statistics.
Linear regression indicated that the difference between injuries in 2010-11 and 2009-10 was insignificant. I then refit the regression model to compare the 2011-12 season to the average of the others. In the previous two seasons, there were on average 7.3 new injuries per day. For the 2011-12 season, it jumped to over 9 injuries per day. The result was highly significant (p-value = 0.0074), which tells us that the jump in injuries this season is larger than can be attributed to random chance. Our conclusion: the lockout has had an effect.
Of course, this agrees with what a lot of people have been saying all along. It makes sense that if you play more in the same amount of time, you’ll get hurt more, all else being equal. My first analysis answered the question, “Are there more injuries in the NBA per day this season?” A better question is, “Are there more injuries per game?”
In other words, does playing back-to-back-to-back games result in more injuries than playing three games in five days?
Injuries Per Game Have Stayed Constant
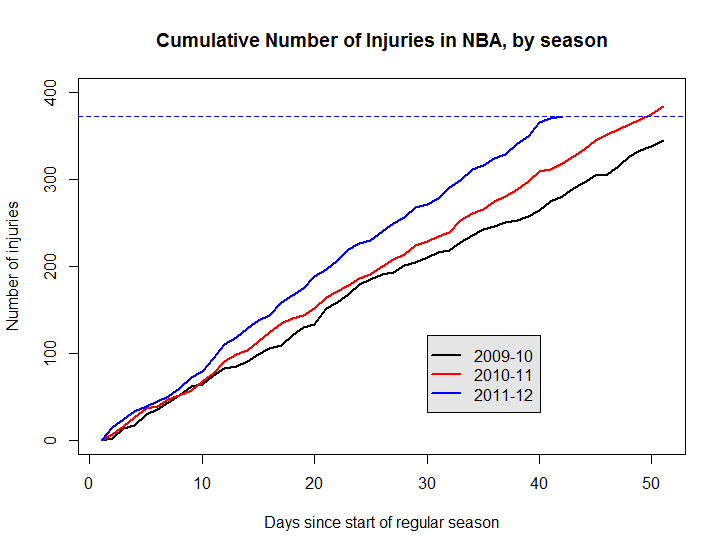
Through February 3 of this year, about 24 games had been played by each team. In the previous two seasons, the 24th game for each team happened around December 15. Instead of comparing the number of injuries occurring in each season across the first 41 days, we can look at the number of injuries across the first 24 games.
Here is the graph for these injuries. The x-axis is still days, but note that for the first two seasons, the axis extends to 50 days. That’s because it took 50 days to reach 24 games. The dashed horizontal line indicates the number of total injuries in the 2011-2012 season up through 24 games.
Since the horizontal line is below the tip of the red line, we see that there are actually slightly fewer injuries per game this year than in the previous year. Thus, the lockout has increased injuries only because more games have been played, and not because of the extra grind associated with back-to-back games.
Final Thoughts
Another interesting question regards the toll of the compacted schedule on players of different ages. Do veterans Kurt Thomas, Grant Hill, and Jason Kidd actually take longer to recover than young bucks like Kyrie Irving or Blake Griffin? You might also wonder if the severity of injuries changes with the compacted season. But these are questions for another day.
The current analysis found that the lockout (or rather, the compacted season that it resulted in) has increased the number of injuries per day, but not the number of injuries per game. The implication is that the total number of injuries incurred by the end of this season will be similar to the total number of injuries incurred by game 66 in previous seasons. Come April, we’ll know for sure.
Doug VanDerwerken is a PhD student in Statistics at Duke University and a lifelong basketball fan.
Printed from TeamRankings.com - © 2005-2024 Team Rankings, LLC. All Rights Reserved.

