How Likely Is A 7-Game Series In The NBA Playoffs?
May 3, 2011 - by David Hess
A comment in our last post (2011 NBA Playoffs Predictions: Conference Semifinals) from Benjamin Morris brought up a claim he’s made previously on his blog. Rather than paraphrase, I’ll quote him directly:
From a purely statistical standpoint, 5 and 6 games are the only two reasonable choices: even for the closest and/or most lopsided matches, the range of expected outcomes is simply not large enough to justify predicting sweeps or game 7′s. The 72-win Bulls 1st round match had an expected series length of around 4.6, which is almost small enough to round down, but that’s as close as any series in 20 years has gotten.
The idea is that, even when a matchup is a tossup, we should pick it to go 6 games rather than 7, and we should pick blowouts to go 5 games rather than 4. We happen to generally agree with him on sweeps – notice that we haven’t predicted any this year, despite some lopsided pairings. Our odds calculations imply that 7 game series are much more likely, however.
Now, judging by his post, he’s delved deeper into the issue of series length than we have. Our current method treats every game as independent from the last, and doesn’t take the series status into account. It’s certainly possible that home field advantage could change over the course of a series, or that the series-leading team tends to play better than the team that’s behind. We wanted to ensure that our 7-game-series picks aren’t totally crazy, so we took a look at some historical data.
Generally, when we pick a team to win in seven games, it’s the favorite. When we pick the worse seed to advance, the odds usually indicate they’ll win in 6 games, closing out the series at home. So the real argument we’re trying to evaluate is whether we should choose “Better Seed in 6” over “Better Seed in 7,” even when our simulation tells us 7 games is more likely.
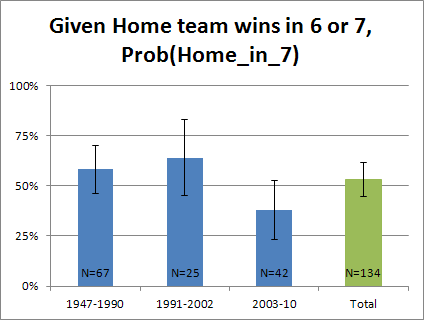
The simplest information to look at, then, is how often the better seed wins in 7 games, given that they do win the series, and that it takes them 6 or 7 games (any other result, and our choice becomes moot). In other words, we’re interested in: [better seed wins in 7]/[better seed wins in 6 or 7]. Here’s what we find when we look back through history (ignoring the NBA Finals, as those have a different format — HHAAAHH instead of HHAAHAH, meaning there’s no road-disadvantage in game 6, which would mean our model wouldn’t be so prone to picking a 7 game series):
I’ve split the data into three time periods. The later period (2003-2010) is the years since the NBA changed the format of the first round of the playoffs from best-of-5 to best-of-7 games. The cutoff between the early and middle periods is arbitrary. I just happened to compile data going back to 1991 (via Basketball-Reference) when I first decided to look into the issue, which allowed me to split that the data I later pulled from WhoWins into two parts.
Those error bars represent the 95% confidence interval for each column (calculated based on the binomial approximation to the normal distribution). While winning in 6 games has been more common than winning in 7 since 2003, the small sample size means there’s a decent chance that the deviation from the overall rate (which is 52% to 48%, in favor of 7 games) is just statistical noise.
The question then becomes, is there some reason to think that the trend we’re seeing is not just due to random chance? Could lengthening the first round from 5 to 7 games really result in road teams suddenly doing better in game 6? Well, if the road teams actually are better now, compared to their opponents, then yes. The first round matchups should feature more lopsided affairs, which should tilt the odds in favor of 6 games.
This doesn’t seem to be the explanation we’re looking for, though, as the first round series actually end in 7 games at a rate relatively close to the historical average. First round series have been won by the higher seed in 6 games 12 times, and in 7 games 9 times, for a 43% 7-games-rate (9 of 21). It’s the later rounds that have changed more since 2003, with a 33% rate (7 of 21). If anybody has an explanation for why adding 1 or 2 more games to round one would make round 2 series easier for the better seed to close out in game 6, I’m all ears.
Lacking an explanation for some kind of drastic shift, we’re going to treat this recent trend towards fewer game sevens as likely statistical noise, and stick with our current model. But because today’s post was just a quick, non-rigorous, sanity check to make sure our picks aren’t totally absurd, we’ll add the issue to our list of possible off-season improvements. We’d love to hear feedback in the discussion section on possible reasons for the trend we see above, or any other comments or questions raised by this post.
Printed from TeamRankings.com - © 2005-2024 Team Rankings, LLC. All Rights Reserved.
