How To Find Undervalued Offenses In College Football
November 1, 2012 - by Ed Feng
This is a guest post by Ed Feng, founder of The Power Rank, a sports analytics site specializing in college football. If you’re interested in guest posting on TeamRankings, email us your post and we’ll consider it.
The goal for an offense is to score points. Duh. So points per game is the ultimate metric with which to evaluate an offense, right?
If only life were so simple in the complex game of football.
For starters, the points per game statistics on most sports sites include touchdowns by the defense and special teams. Touchdowns on kick returns help a team win games, but they do not say much about the offense. (Here’s TR’s estimate of offensive points per game by team.)
Also, turnovers can prevent an offense from scoring after a long drive, which means they get zero credit for successfully moving the ball down the field. But that’s fair, right? Throwing an interception on the goal line certainly reflects poorly on the offense, and counteracts the benefit of the long drive.
If you’re trying to describe what actually happened, sure, that’s fair. But maybe not if you’re trying to predict the future.
Earlier this season, we presented data on the randomness involved in forcing turnovers. In college football, the number of turnovers forced in the first 6 games explains only 3% of the variance in turnovers the rest of the season. Are the results any different on offense?
Offensive Turnovers Are Random
In short, no. Giveaways are almost completely random. Sure, there is some level of skill (or lack thereof) that can be attributed to each particular turnover. But overall, past turnover rates are almost useless for predicting future turnover rates.
First, let’s consider early to late season correlations in fumbles. Fumbles lost by the offense during the first six games explain only 2.6% of the variance in fumbles lost the remainder of the season. (For all you stat geeks, that’s a correlation coefficient of 0.16) Translation: there isn’t much hope in predicting future fumbles from a team’s current total.
How about interceptions? Here, we’ll look at interception rates, or the fraction of pass attempts that the defense catches. Interceptions rates in the first six games explain 4.6% of the variance in late season interception rates (0.21 correlation coefficient). While there is a stronger correlation for interceptions than fumbles, interception rates still strongly regress to the mean.
No one can predict accurately when the quarterback will have a bad exchange with the running back, or the center will hike the ball over the QB’s head. It’s also next to impossible to predict when a linebacker will take the perfect angle on a running back, plant his helmet right on the ball, and knock it loose.
In the passing game, the quarterback certainly has some skill in not throwing the ball directly into the hands of a defender on the other team, or in making a decision not to throw into triple coverage rather than take a sack when the risk/reward tradeoff of doing so is unwarranted. When a pass is tipped, though, it could land in anyone’s hands.
All this is good news for some teams.
Yards Per Play: An Alternative Metric For Offense
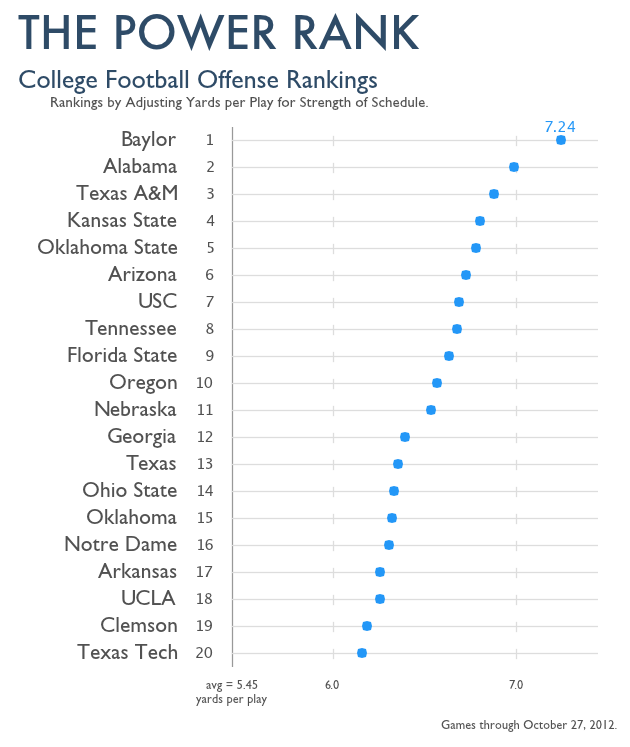
Since turnovers and other factors can greatly affect a team’s raw scoring offense statistics, we suggest yards per play as another criteria to judge an offense. A high yards per play means an offense can move the ball. Moreover, this metric stays more consistent over the season than interception rates or fumbles. At The Power Rank, we adjust yards per play for strength of schedule to rank offenses.
From these rankings, the following three teams have undervalued offenses that could score lots of points the remainder of the season.
Michigan. Led by quarterback Denard Robinson, the Wolverines have scored 28 points per game, 64th in the nation. However, 14 interceptions have limited their scoring. Michigan fell to 21st in our offense rankings after Robinson got hurt at Nebraska this past weekend. However, 21st is still a stark contrast from their 64th in scoring offense. Look for Michigan to put up more points the remainder of the season, especially with the lack of elite defenses on their remaining schedule.
Arkansas. The Razorbacks have scored 27 points per game, 69th in the nation. However, turnovers have plagued this offense, as they fumbled the ball 8 times (lost 3) in getting shut out by Alabama. By adjusted yards per play, Arkansas comes in 17th in our rankings. This rank might even underestimate the Razorback offense. Quarterback Tyler Wilson didn’t play against Alabama, a game in which his teammates only mustered 2.8 yards per play.
Tennessee. Head coach Derek Dooley threatened to bench quarterback Tyler Bray after his 2 interceptions against Alabama. While his 9 interceptions at that point in the season makes a coach uneasy, at least one pick against Georgia resulted from a tipped pass. The Volunteers have actually scored 34.5 points per game, 30th in the nation. While their raw 6.26 yards per play puts them 27th in the nation, our schedule adjustments move Tennessee up to 8th. Life is difficult against the top ten defenses of Alabama, Florida and South Carolina.
How To Find Undervalued Offenses
Team Rankings has lots of awesome resources for college football. To find more undervalued offenses, you can check out the giveaways rankings. The teams at the bottom of this list are prime candidates to have an underrated offense. If these teams have a much higher rank in our offense rankings than raw points per game, they could be poised for breakout scoring for the remainder of the season.
If you find a team, please tell us about it in the comments below. Thanks for reading.
Printed from TeamRankings.com - © 2005-2024 Team Rankings, LLC. All Rights Reserved.
